The overview following:
- An activity chart with the number of hits over time.
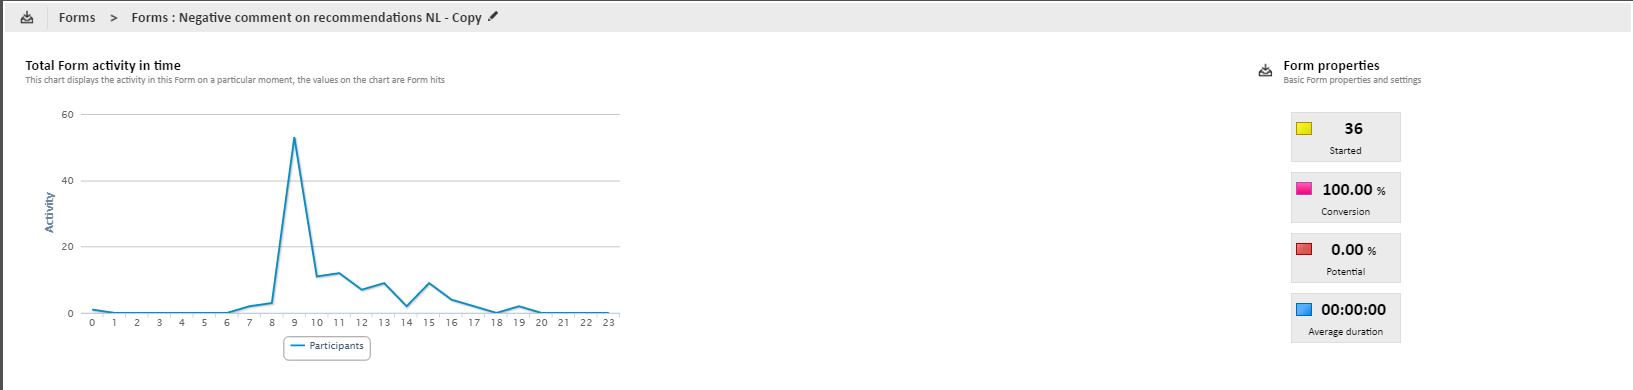
- KPI's:
-
- Started — Total number of contacts that have started the form
- Conversion — Proportion of contacts that have completed the form
- Potential — Proportion of contacts that can still complete the form
- Average duration: Average time spent on the form
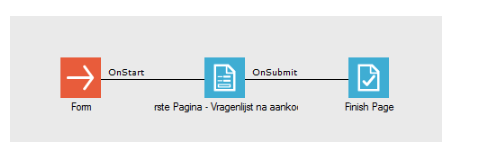
- A graphical representation of the form sequence is displayed. Hover a page to display page related statistics.
-
- Number of contacts — Distinct visits based on the user ID
- Number of hits — Total visits
- Number of invalid hits — Page submitted with errors
- Average number of warnings per invalid hit
- Minimum completion time
- Maximum completion time
- Average completion time
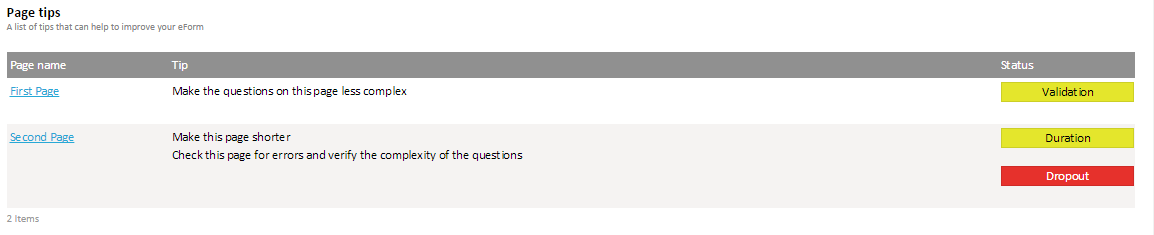
The above numbers allow a marketer to quickly identify if the page is a problem within the form and if it is likely to create dropouts.
A page with a high number of invalid hits and warnings might indicate that the page is too complex. When the average time on a page is relatively long in comparison to other pages, it might indicate that the page is too complex or too long.
- Page tips — A list of tips is available that might help analyzing and improving the form.