Email Summary
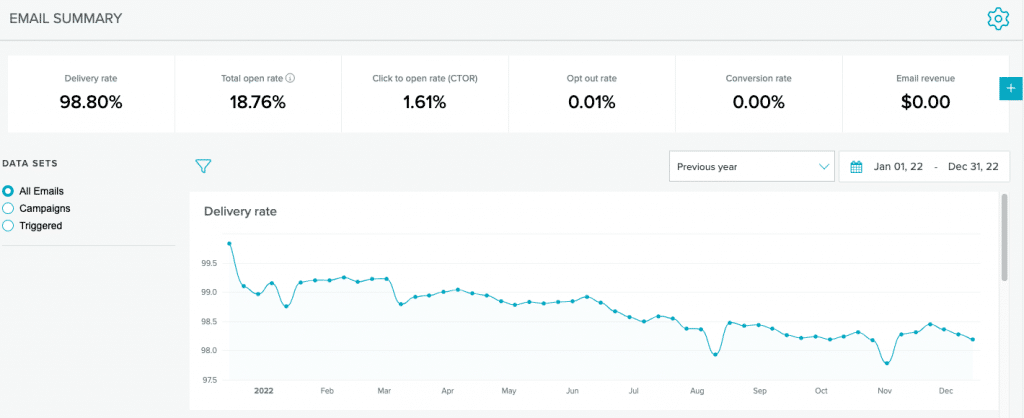
See the engagement of your campaigns and triggered sends over time with Email Summary. Located in the Analytics menu under Summary, this report offers a consolidated view of all your sends within your configuration.
Settings
Change metric window days from the Analytics Settings modal. Select the gear icon  above the headline metrics to open the modal. From this screen, select your metric window days.
The metric window days option is a time windowing function. Selecting one of the time windows will show the metrics attributed to a campaign starting the day of the send and ending on day 7, 14, or 28.

What this means:
- Selecting 7 will show your selected metrics, for example clicks, attributed to a campaign within 7 days from the send.
- Metrics that are attributed after day 7 will not be shown. If a message is opened and clicked on day 8, that will not be included.
- If you need to see metrics attributed after day 28 or during a different specific time period, use the date picker to select a custom range.
The Report
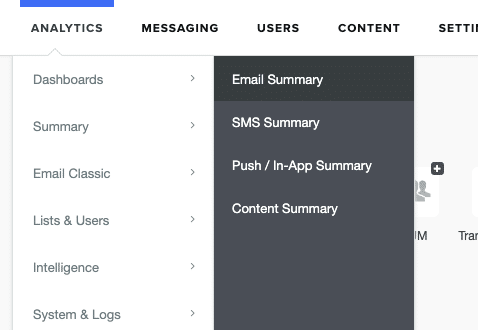
View aggregate data for your email sends. Locate the Email Summary report in the Analytics menu, under Summary.
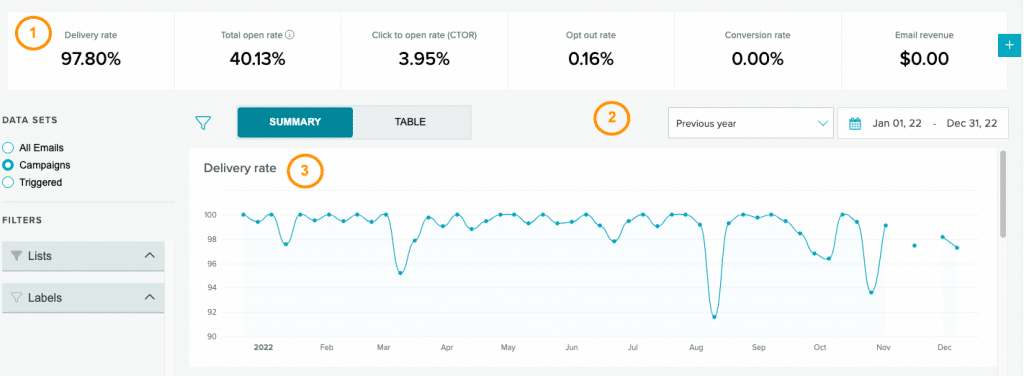
The report is broken up into three main sections, numbered in the following image.
- Headline Metrics
- Filters
- Charts
Reporting is about 3-6 hours lagged from real-time. As data comes in, it is updated continuously.
Headline Metrics
This section includes numerical and percentage data for your email sends over a specified time. By default, you will see the Delivery rate, Open rate, Clicks/Opens, Optout rate, Conversion rate, and Email revenue for a one month period. You can add more options or remove any you don't need to see.Add Metrics
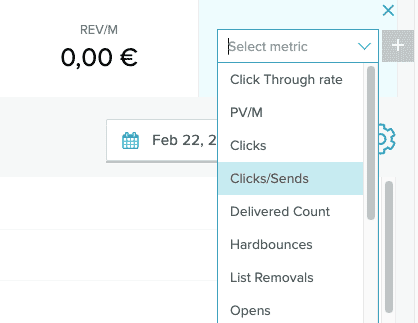
Select the blue plus icon  at the end of the Headline Metrics row to add metrics. This adds another metric box to the row with a drop down menu. Select the metric you wish to add from the list.
Remove Metrics
To remove any metric from the headline row, hover over the top right corner of the box. Select the x in the corner of the box. The metric will be removed immediately.
Apple MPP Metrics
Email Summary provides special metrics to improve accuracy and mitigate the effects of Apple MPP. The metrics specific to Apple MPP are:
- Projected open rate - The open rate of the recipients whose interactions were not hidden by Apple MPP. (Click here to view the previous release article.)
- Total unique open rate - The % of received messages that were opened, includes both human and machine unique opens.
- Pre-cached open rate - % of messages pre-cached by a machine open.
- Real open rate - % of messages opened or clicked on by a human.
- Real and pre-cached open rate - % of pre-cached messages that recipients later clicked on a link and/or read outside of the Apple Mail app.
For a complete description of the metric, see the Email Summary Metrics section.
Filter Data
The Configuration options available for the Summary view allows you to change the date ranges that the reporting pulls from, change views between 'Summary' and 'Table', and change the filters that matter to you. You can also change your metric window days.View by Date
Quickly and efficiently select date ranges for analyzing your email performance. Select your own date range using the date picker or use one of the date range presets to make a quick selection.
If you select a date range that goes back farther than 90 days, Email Summary may show you statistics going back to the beginning of the week selected and not the exact selected date.

As you make changes to the selected dates, the headline metrics and displayed data will both change to reflect data for your selected time period.
Date Presets
Select from seven date range presets to quickly see only the data you need. The default preset is Previous Day, so you see the most recent data when you open Email Summary. 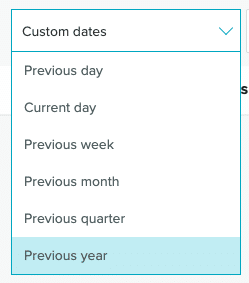
The available presets include:
- Previous day
- Current day
- Previous week
- Previous month
- Previous quarter
- Previous year
- Custom date (define your own date range)
Date Picker
Use the date picker to select a single day or a specific range of dates. As you select dates, the preset options will change based on your date range. For example, if you select the previous week as your calendar date range, the preset option for Previous Week will populate the date preset dropdown menu. 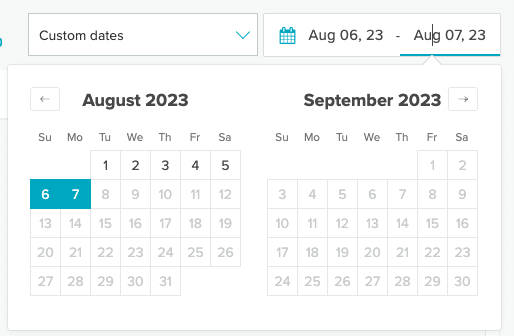
Filter by Message Type
So you can keep your email summary view organized, all filters are behind the filter icon . Click the  icon to open filter options and select the type of message you wish to view.
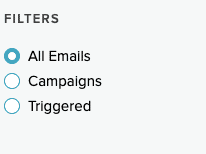
Filter by Campaign
If you select Campaigns, more filter options are available.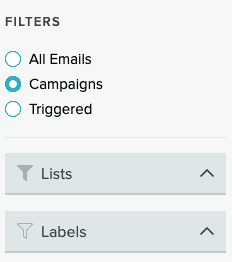
Selecting either Lists or Labels shows the search options.
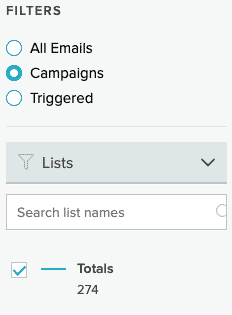
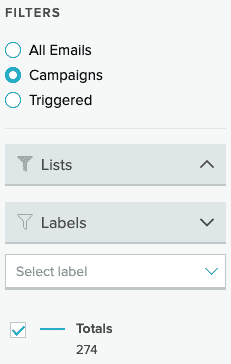
Either type the list or label name into the search box or scroll through your available lists or labels using the dropdown menu. Select one or multiple lists or labels to compare performance on a specific date or over time.
Filter by Triggered Message
Selecting Triggered Messages from the filter options gives the option to filter by label or by Lifecycle Optimizer flow.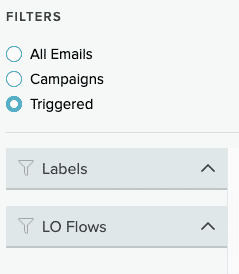
Selecting Labels or LO Flows opens further filtering options.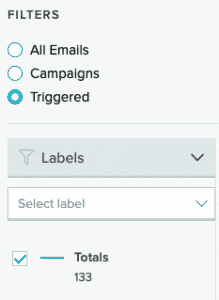
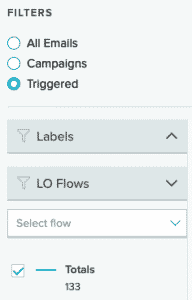
Type the label or flow name in the Select box or use the drop-down menu to scroll through the available labels or flows. Select a single label or flow to see the performance over time, or select more to compare performance.
Table View
View message metrics as charts or in a table view. When you select the filter icon and set the filtered message type to Campaigns or Triggered, more configuration options are available. Select Table to switch to table view:

If you keep the filter options open, you can filter the table by list as you can the charts:

Customize the Column View
Customize what data you see and the order you see it in.
Select the table icon  to open the Selected Metrics menu. Click on any of the column titles to sort by that column. The Campaign Name will always be pinned. You may pin any other metrics by selecting the pin icon next to the metric name.
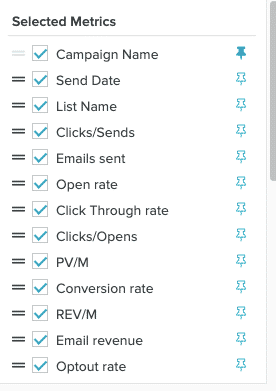
Use the checkboxes to add or remove metrics. Select the double bars next to the metric name and drag it into the correct position.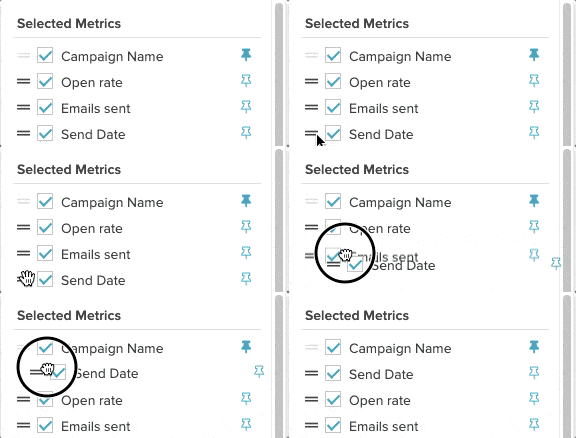
List Removals
If this feature and metric is enabled on your account, you will see a column in the Campaigns table view for List Removals. A List Removal occurs when a user unsubscribes from a specific list associated to a Campaign send by clicking the email service's unsubscribe link. The email service then sends this information in a feedback loop, which the system then parses where a customer manages multiple brands in one instance.

If you wish to have List Removal metrics available in Email Summary, speak with Support.
Charts
Each metric within the Headline Metrics section has a corresponding line chart.
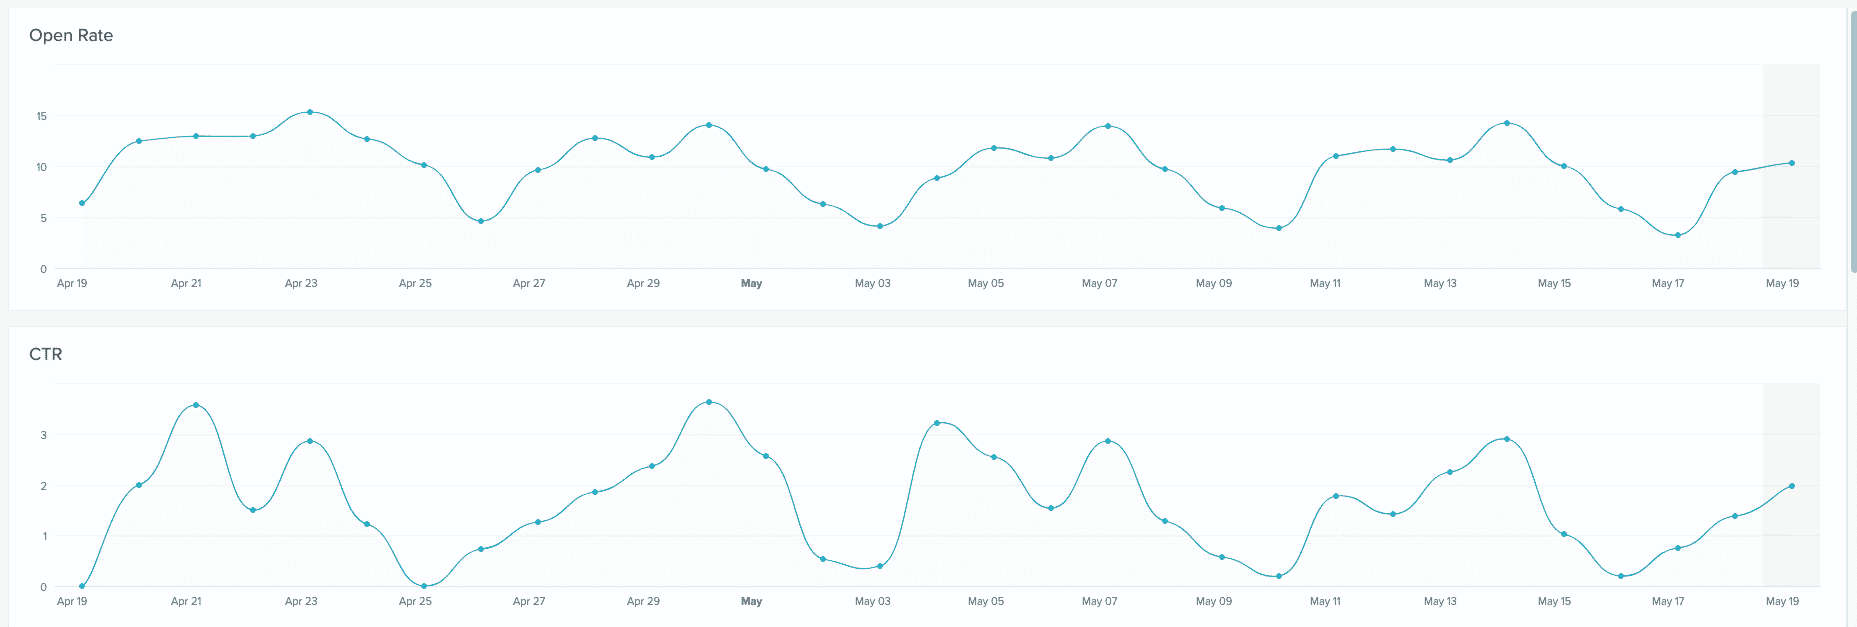
If you wish to download or save your charts, hover over the top right corner of the top chart. A download icon appears with an options menu.
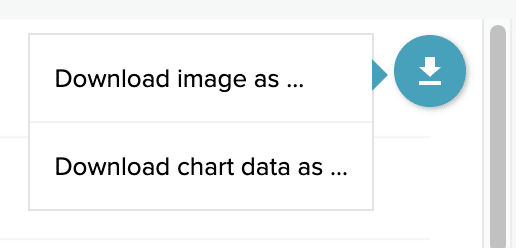
Hover over the download option you wish to use to select the file type.
Report Sharing and Bookmarking
To share a report, copy the URL and share it. To view a shared report, past the URL into your browser. To bookmark a report with headline metrics and filters already configured to your preference, use your browser's bookmark functionality and label the view according to your preference. When you're viewing a shared report, the top bar is yellow, tells you who is sharing with you, and contains an Exit Shared View button.
Export Email Send Data
Email Summary allows you to export both chart and table data.Export Chart Data
To download Email Summary charts:- Select the aggregate data you wish to export using the available filters.
- Hover over the top right corner of the top chart. A menu will appear with two options:
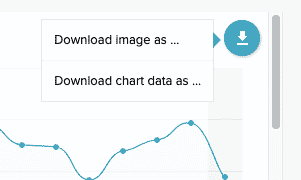
- Download image as...
- Download chart data as...
- Select one of the options to download an image or the chart data.
- Hover over Download image as... to select from one of the image options: PNG, JPG, SVG, or PDF.
- Hover over Download chart data as... to select from one of the format options: CSV, XLSX, or JSON.
- When you select an option, the download will start automatically.
Export All Table Data
To export all table data:- Select the Filter icon to open the message filters.
- Select Campaigns or Triggered and apply any other filtering with the Lists and Labels options.
- Navigate to the Table view.
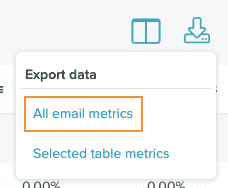
- Click the Download icon
 to the left of the date range picker to open the export menu.
 - Select All email metrics from the export options. Your CSV file will download immediately.
Data is available starting from Winter 2017 onwards.
When you open your file, it should resemble the following image:

There are two general sections of the file - the leading rows, and the data content.
Within the leading rows, you can get more information about when the download was generated, what Email Summary link generates this report, and the timezone of the data itself.
The data content includes all of the metrics available for Email Summary. Each row is a send, with associated send metrics, metadata, and deep link to the detail view. See Email Summary Metrics for more information about what each metric means.
Export Selected Table Data
Export only the data you have selected.- Select the Filter icon to open the message filters.
- Select Campaigns or Triggered and apply any other filtering with the Lists and Labels options.
- Navigate to the Table view.
- Click the Selected Metrics icon to open the selection pane.
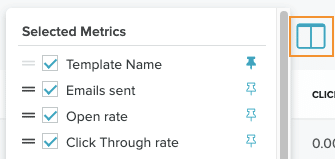
- Select which metrics you wish to display.
- Select the Export icon to open the menu.
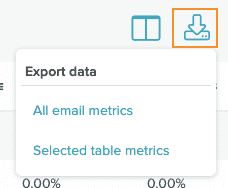
- Click Selected table metrics. The CSV file will begin downloading immediately.
Email Summary Metrics
| Name | Description |
| Sent | Count of the number of emails sent for the corresponding Campaign or Triggered send in the time period selected. |
| Unique Beacons | The count of unique users who opened the email with images enabled in their email client, loading your included beacon image. |
| Unique Opens and Rate | Unique count and % of messages that were opened, includes both human and machine opens. % = unique opens / delivered |
Pre-cached Opens & Rate | Unique count and % of messages pre-cached by a machine open. % = precached opens / delivered Apple MPP pre-cached events are the only machine opens currently being tracked.
|
Real Opens & Rate | Unique count and % of messages opened or clicked on by a human. % = real opens / delivered
|
Real and Pre-cached Opens & Rate | Unique count and % of pre-cached messages that recipients later clicked on a link and/or read outside of the Apple Mail app. % = real and precached opens / delivered
|
Projected Opens Count & Rate | Unique count and % of messages opened from recipients whose interactions were not hidden by Apple MPP. % = real opens / visible profiles
|
| Unique Clicks to Open Rate (CTOR) | The percentage of unique clicks by unique opens, includes both Real and NHI. |
| Unique Real CTOR | The percentage of unique real clicks by unique real opens |
| Clicks/Sends | The clicks metric divided by the send metric given a blast/triggered send within the date range selected. |
| Hard bounces | The count of failed delivery instances of an email send due to a permanent reason such as a non-existent address. |
| Soft bounces | The count of instances where an email send encountered a delivery problem or failed delivery. |
| Delivery count | The count of emails sent minus bounces (which include softbounces and hardbounces). |
| Delivery rate | The count of emails sent minus bounces, divided by emails sent. Bounces include hardbounces and softbounces. |
| Unsubscribe rate | The unsubscribe count divided by the delivered count. |
| List removal rate | THe list removal count divided by the delivered count. |
| Email revenue | The total price of item(s) purchased by a user, where attributed to a send. The Purchase API must be implemented for this metric to render a non-zero value. |
| AOV | Average Order Value. Calculated by the total purchase revenue over the total number of purchases. |
| Pageviews | The number of pageviews generated by clickthroughs from a Campaign or Triggered send. The Javascript library generally needs to be implemented for this metric to render a non-zero value. |
| PV/M (pageviews per thousand messages divered) | The number of pageviews generated by clickthroughs from a Campaign or Triggered delivered count, per thousand. The Javascript library generally needs to be implemented for this metric to render a non-zero value. |
| Purchases | The count of users who performed a purchase action on your properties, attributed to a Campaign or Triggered send. The Purchase API must be implemented for this metric to render a non-zero value. |
| REV/M (revenue per thousand users) | The sum of purchase revenue generated by purchases from a Campaign or Triggered delivered count, per thousand users messaged. The Purchase API must be implemented for this metric to render a non-zero value. |
| Conversion rate | The purchase count over the clicks for a given Campaign or Triggered send. |
| Complaints | The count of users who marked an email as spam in the inbox (as opposed to using a hosted page to opt out), and were opted out. |
| Complaint rate | The count of user complaints divided by the count of emails delivered, for a given Campaign or Triggered send. |
| Opt outs | The count of users, where the user opted out via a Hosted Page. This metric provides insight into the opt outs received when a user clicks a link within the body of an email message. |
| Opt out rate | The count of users who have chosen to opt out divided by the count of emails delivered, for a given Campaign or Triggered send. |
| Unsubscribe | The number of application-level unsubscribes received from an ISP, where the user opted out via the header one-click unsubscribe link in the user’s email service client. This metric only applies to accounts that do not have the List Removal feature enabled. |
Total Real Clicks & CTR | The total number of Real clicks from all links in a message, includes multiple clicks by a recipient within the same message. CTR is total real clicks / delivered |
Unique Real Clicks & CTR | The number of real unique clicks from all links in a message CTR is unique real clicks / delivered |
Total Clicks & CTR | The total number of clicks from all links in a message, includes both Real and NHI. CTR is total clicks / delivered |
Unique Clicks & CTR | The number of unique clicks from all links in a message, includes both Real and NHI CTR is unique clicks / delivered Note: It is possible for a user to have both a real click and an NHI click, so the sum of the Unique Real Clicks and CTR and NHI Clicks and CTR may be larger than the Unique Clicks metric. |
Total NHI Clicks & CTR | The total number of NHI clicks from all links in a message, includes multiple clicks by various NHIs. CTR is total nhi clicks / delivered |
Unique NHI Clicks & CTR | The number of NHI unique clicks from all links in a message. CTR is unique nhi clicks / delivered |


