
Dashboard
Overview
The Dashboard provides a high level summary of recent activity in the current system. When viewing the Dashboard, the Workspace is split into the following three sections:
-
Performance tab:This default tab provides Cross-Channel Performance Insights, displaying a consolidated view of unique human click rates and deliverability across email, SMS, and push campaigns within the same period. It offers immediate cross-channel engagement and deliverability insights upon login and can be filtered by date.
This tab is only available when you login to Cheetah Digital using Zeta Login.
This tab includes the following reports:
-
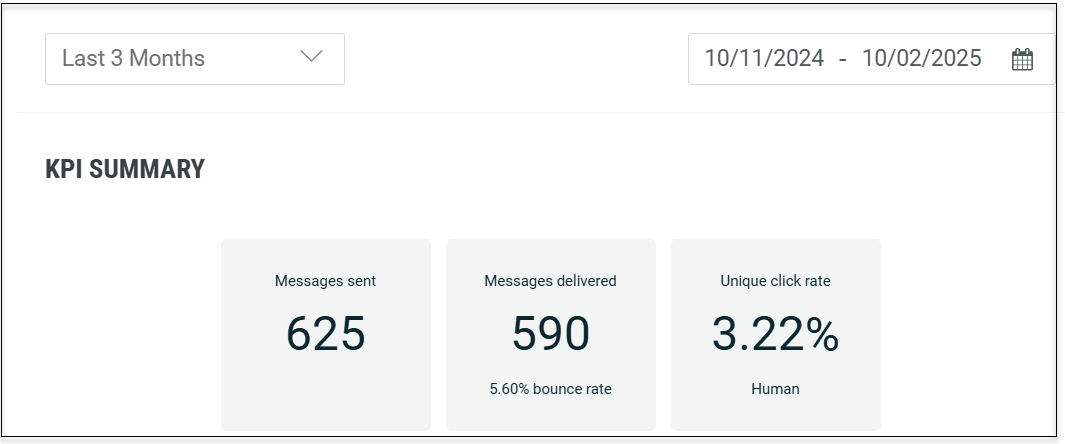
KPI Summary: This report provides summary of key performance indicators across multiple channels, including the number of messages sent, messages delivered, and unique click rates.
-
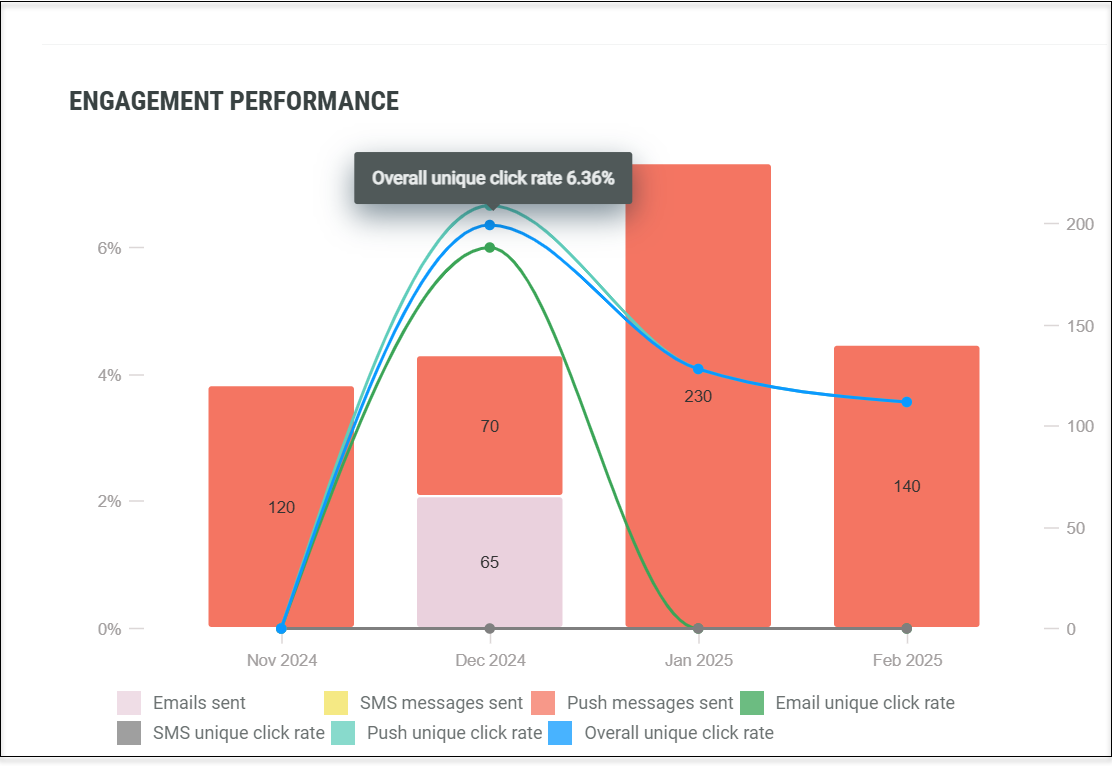
Engagement Performance: This report presents real-time campaign performance metrics across Email, Push, and SMS channels. It includes a bar chart displaying the number of messages sent and a graphical representation of unique click rates. Hover over the graph to view specific percentage details.
-
Delivery Performance: This report presents real-time campaign delivery metrics across Email, Push, and SMS channels. It includes a bar chart displaying the number of messages sent and a graphical representation of bounce rates. Hover over the graph to view specific percentage details.
`
-
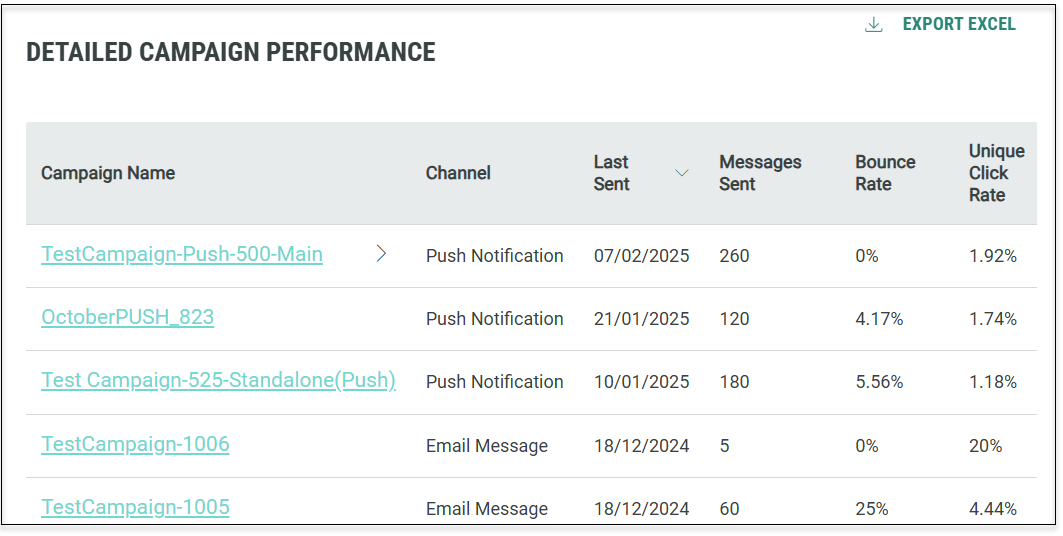
Detailed Campaign Performance: This report presents a summary of all the campaigns with quick links to deeper reporting details. The list can also be exported as an Excel file.
-
-
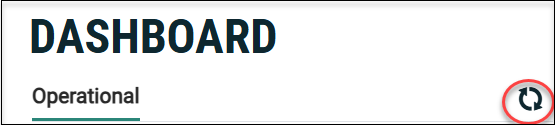
Operational tab: This tab displays a running log of all activity, by all users, within the current system. The activities are grouped by day, then sorted in chronological order, with the most recent activity appearing at the top of the screen. Each entry in the Stream shows the timestamp, an icon representing the type of item that was impacted by the entry, the name of the item, a brief description of the action that was taken, and the name of the user who performed the action.
To view the details of an item, click the name of the item. The platform displays the selected item, and opens a new tab for this item in the Top Navigation Pane. This tab appears immediately to the right of your current tab.
To refresh the Stream section, click the refresh button (double-arrow icon).
-
System Announcements: This section contains important information, such as industry news and product release details. This is located to the right of the stream.
To refresh the System Announcements section, click the refresh button (double-arrow icon).
Access
The Dashboard is the main landing page for Cheetah Digital, and is displayed by default each time you log into the platform.
The Dashboard is also accessible by clicking the home icon ![]() in the top navigation pane.
in the top navigation pane.