
Campaign Report Description -- Comparisons
Access
The Comparison report is available by selecting Comparisons from the Campaign Report navigation menu. This option is displayed only if the currently selected Campaign Report has multiple Campaigns as the report's data source (see Campaign Reports for more details on selecting the report's data source).
Description
The Comparisons Report displays key reporting metrics for every Campaign included within the report, allowing you to quickly compare results and activity generated by each Campaign.
The Comparisons report allows you to select a specific reporting metric, in order to see how that metric trends across time for all Campaigns included in the report:
-
In the Metric drop-down menu, select the desired reporting metric. The options are:
-
Overview (Default option)
-
Reads / Opens
-
Shares
-
Link Click Activity
-
Form Submissions
-
Mobile Responses
-
Bounce Backs
-
Opt-Outs
-
-
From the Value drop-down menu, select whether you want to compare Amounts or Percentages.
-
Optionally, enter a start date and end date for the period you want to view.
-
For the Overview and Opens metrics, you can choose to exclude/ include the false opens by the pre-cached server across the campaigns and cells in the report, by selecting/unselecting the Exclude Pre Cached Opens checkbox. By default, the pre-cached opens are excluded.
-
For the Overview and LinkClick Activity metrics, you can choose to exclude/ include the Bot clicks in the report data, by selecting/unselecting the Exclude Bot Clicks checkbox. By default, the clicks by the Bots are excluded.
-
Click update comparison.
The default view of the Comparisons report is the Overview.
The default view lists all of the Campaigns included within this Campaign Report, and displays the following metrics for each Campaign:
-
Campaign: The name of the Campaign.
-
# Sent: The number of messages deployed for the Campaign.
-
# Bounces: The total number of both hard and soft bounces received for the Campaign.
-
% Bounces: The percentage of messages deployed that resulted in a bounce.
-
# Reads: The number of people who had any activity as a result of the Campaign, indicating they had to have read the message.
-
% Reads: The percentage of messages deployed that resulted in a read.
-
# Clicks:The number of unique link clicks for the Campaign.
-
% Clicks: The percentage of messages deployed that resulted in a click.
-
# Opens: The number of messages that were opened from the Campaign.
-
% Opens: The percentage of messages opened with respect to the total messages deployed.
-
# Opt-Outs: The number of unsubscribe requests received for the Campaign.
-
% Opt-Outs: The percentage of messages deployed that resulted in an unsubscribe request.
A bar graph is displayed next to each of the "%" columns listed above. These bar graphs are proportional to each other, and are intended to provide a quick, visual way of comparing Campaigns. The Campaign with the highest percentage for a given metric will have a "full" bar.
By default, the Overview report is sorted alphabetically by Campaign name. To sort by a different column, click on the title for the desired column. The list is refreshed to sort by that column in ascending order. Click the same column a second time to toggle the sort order to descending.
For the other metrics, the resulting report shows the selected metric broken out by month, allowing you to see how the selected metric is trending. A bar graph is displayed in each column. The month with the highest percentage will have a "full" bar.
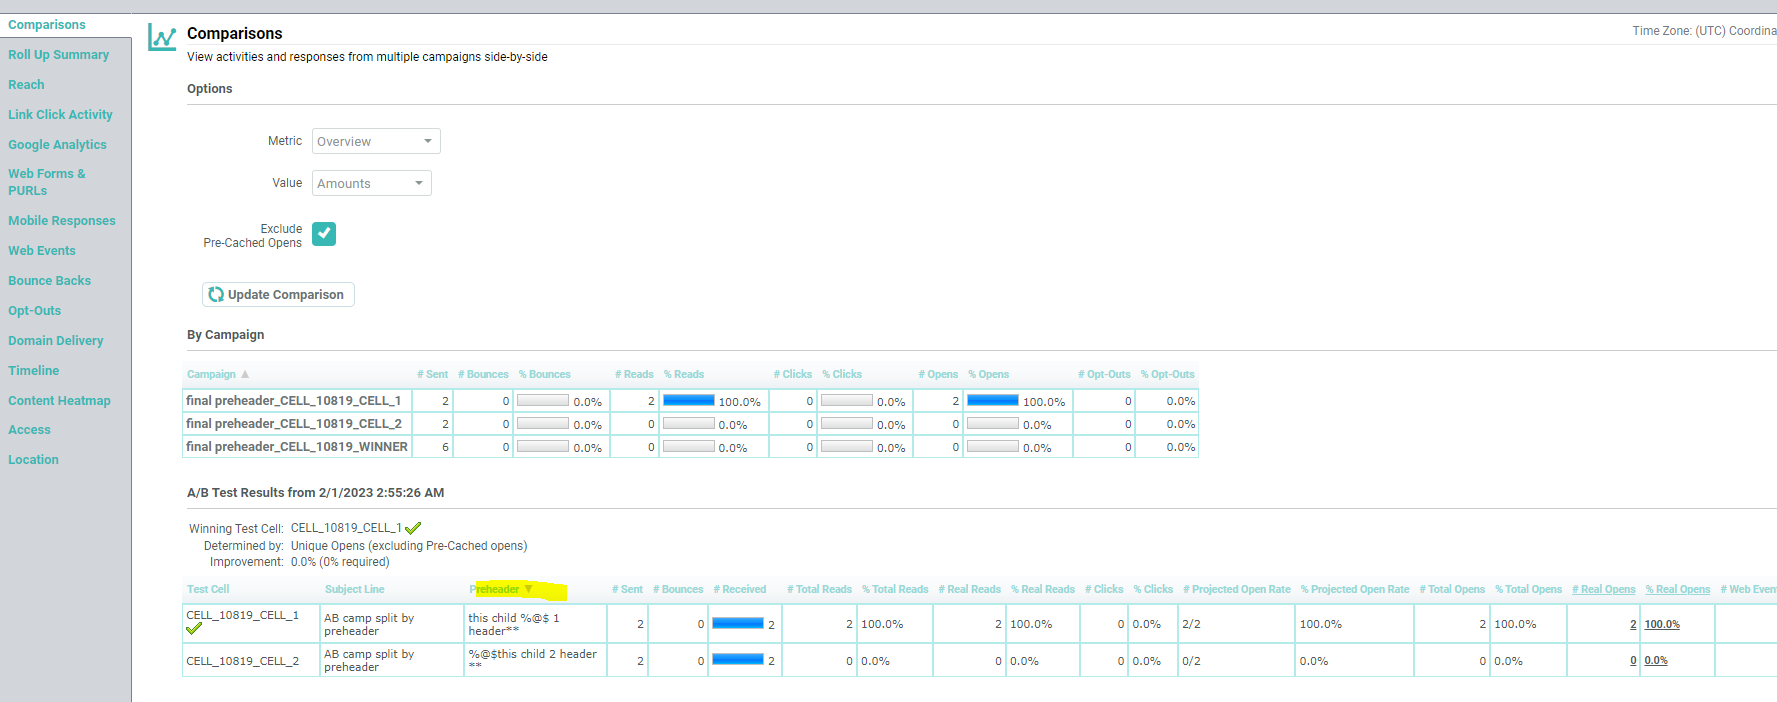
A/B Test Results
This section shows the metrics at the time when the process selected the winner cell for the A/B Test. A/B test is used to compare the effectiveness of a Campaign element in order to determine a winner cell. The Campaign elements that determined the winner is listed at the header of the report. The following details of the test cells when the winner cell has been created, are shown in the report.
-
Test Cell: The cell's code to identify the test cell.
-
Subject Line: Thesubject line of the email campaign
-
Preheader: The email preheader of the campaign, the invisible text that is added to the top of an email’s HTML to become the preview, instead of the first line of email text.
-
# Sent: The number of messages deployed for the Campaign cell.
-
# Bounces: The total number of both hard and soft bounces received for the Campaign cell.
-
# Received: The percentage of messages deployed that resulted in a bounce.
-
# Total Reads: The total number of people in the cell who had any activity as a result of the Campaign, indicating they had to have read the message.
-
% Total Reads: The percentage of messages deployed that resulted in a read.
-
# Real Reads: The number of real people (excluding pre-cached) who had any activity as a result of the Campaign, in the cell, indicating they had to have read the message.
-
% Real Reads: The percentage of messages deployed that resulted in a real read.
-
# Clicks:The number of unique link clicks for the Campaign, in the cell.
-
% Clicks: The percentage of messages deployed that resulted in a click.
-
# Projected Open Rate: The number of open rate of the recipients in the cell, whose interactions were not hidden by pre-cahed server. The row with the highest Projected Open Rate indicates the combination of Preheader and Subject Line that produced the highest open rate, without noise from pre-cached server (Apple MPP).
-
% Projected Open Rate: The percentage of open rate of the recipients in the cell, whose interactions were not hidden by pre-cahed server.
-
# Total Opens: The number of messages that were opened from the Campaign.
-
% Total Opens: The percentage of messages opened in the cell, with respect to the total messages deployed.
-
# Real Opens: The number of messages that were opened in the cell, from the Campaign.
-
% Real Opens: The percentage of messages opened in the cell, with respect to the total messages deployed.
-
# Web Events: The number of unsubscribe requests received for the Campaign, from the cell audience.
-
% Web Events: The percentage of messages deployed that resulted in an unsubscribe request, from the cell audience.