Campaign Report Description -- Timeline
Access
The Timeline section is available by selecting Timeline from the Campaign Report navigation menu.
Description
The Timeline report provides the marketer with a powerful view into the number of messages delivered, and at what point post-delivery customers took action on that message. Over a period of linear dates, the marketer can view statistics on the following metrics:
-
Sent
-
Merge Errors
-
Bounces
-
Total Opens
-
Pre-Cached Opens
-
Real Opens
-
Total Clicks
-
Real Clicks
-
Shares
-
Facebook Likes
-
Web Form Submissions
-
Mobile Responses
-
Opt-Outs
-
Web Events
The metrics Pre-Cached Opens and Real Opens are available for selection only when the Preference flag precache_enabled_bitmask is set.
Viewing Options
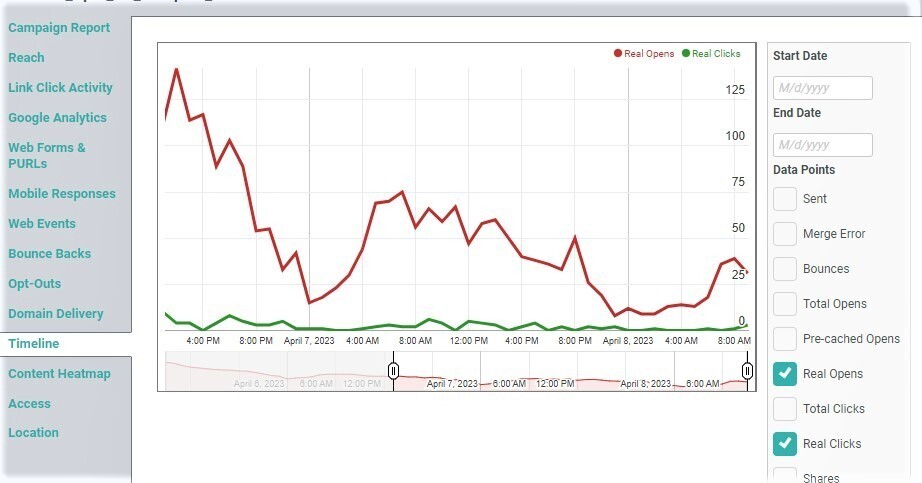
When displayed, the report plots the selected metrics along a linear timeline.
The pane along the right-hand side of the screen provides various options regarding the message content.
-
Enter a start date and end date for the Timeline.
-
Using the check boxes, select the activities that you want to plot on the Timeline.
After making either of the above modifications, click update timeline to refresh the report.
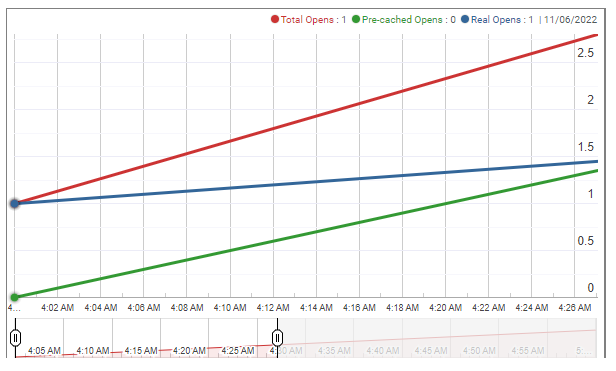
As you slide your mouse cursor left-and-right over the report, the system updates the counters in the top-right corner of the Timeline. These counters represent the quantities for all selected metrics at the point in time to which your cursor is currently pointing.
The Timeline report also has a "zoom" function that let's you focus on a particular segment of time. Beneath the Timeline is a separate graph, with a red line representing all the activities for this Campaign. At the right and left edge of this graph are two sliders. Click-and-drag these sliders to narrow the focus of the Timeline. The Timeline is refreshed. The scale of the report automatically adjusts as well.