
Database Reports
Overview
The Database Report provides counts and statistics on the Tables in your Cheetah Digital by Zeta database. The report shows the number of records and the number of populated cells in each Table in your database.
Additionally, you can use the Database Report to show changes in record count over time, so you can track how your database size is changing.
Access
The Database Reports screen is accessible by the following method:
-
From the Main menu, select Insights > Legacy > Database Report
Features
View the Database Report
Overview
The Database Report provides counts and statistics on the Tables in your Cheetah Digital by Zeta database.
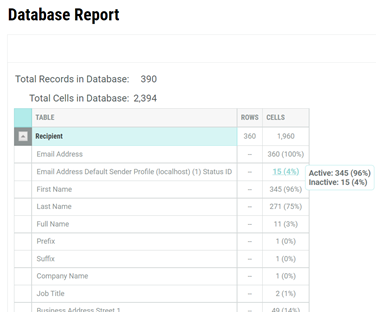
High-level statistics are displayed at the top of the Database Report, including the total number of records, and the total number of cells, in the entire database.
Table Detail
All of the populated Tables in your database are listed on the Database Report screen. Next to each Table name, the report displays the total number of records, and the total number of cells, in this Table.
To view Table-level details, click the down-arrow icon next to a Table name to expand that Table. The system lists all of the Data Fields in this Table. For each Data Field, the report displays the total number of populated cells, and the percentage of the total number of table records.
For a Sender Profile Status ID field, hover your mouse cursor over the Cells value to see a tooltip that shows the total number of Active and Inactive records, and the percentage of the total number of table records. Please note that the Active count within the tooltip indicates the number of records that are null or have a value of "100;" the Inactive count within the tooltip indicates the number of records with a value other than "100."
To collapse the Table-level details, click the up-arrow icon next to the Table name.
Database Growth
Each night, the platform calculates the number of records in each Table, as well as the number of records added each month, in order to show how your database is growing over time.
To view database growth statistics:
-
In the Range fields, enter the desired from date and to date.
-
Click show data.
-
The Database Report is refreshed. Additional columns are displayed in the report for each month included within the date range you provided. These columns indicate the number of new records added to each Table within a given month.