Publishing and Monitoring your Journey
Journeys is an orchestration tool that offers non-technical marketers end-to-end capabilities to manage and deliver personalized interactions at scale. Journeys allows marketers to easily create a multi-step campaign helping them browse, build, publish, and manage advanced journeys based on existing Engage+ assets.
Once you have built and tested your Journey, it is time to publish your work. After publishing, there are ways to easily update and monitor your journeys. In this article, we will discuss how to report, publish, and monitor your journey(s).
Publishing your Journey
You can publish a journey once you have completed configuring your canvas.The Journey Healthcheck will help you to make sure that you have everything that you need in order for your journey to run successfully.
To publish your Journey:
- In the right hand corner, click Save.
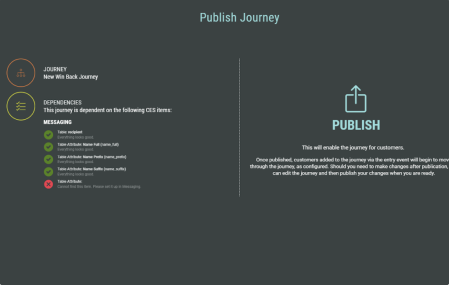
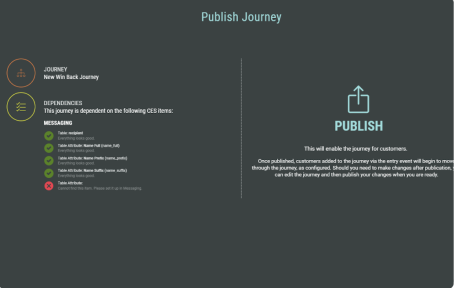
- Click Publish.
- Click the upload icon labeled Publish on the right.

Making Changes
If you want to make changes to a journey that is running, Journeys allows you to do this.
When opening the canvas, you’ll notice that it is locked before you can make any changes.
When you are happy with these changes, you can publish again.
Any customers already on a journey will continue on the previous version, and the updates will only be seen by new customers.

Journey Metrics
Remember in Building a Journey that we went through different Exit types? This is where it pays off. Journey Metrics shows the total live customers in journeys, as well as entries and the different exits.
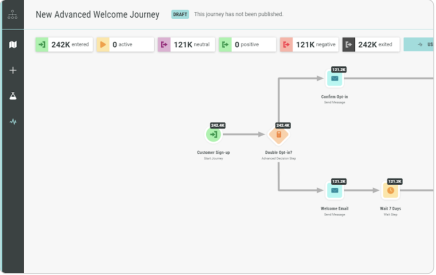
At the top of the Journey Metrics tab, you can see displayed:
- Total Entries
- A live count of the customers in the journey
- Total Exits, and a break down of your different exit counts
There is also a live preview of the count of the total number of customers who have passed through each step (you can filter the time frame from the top).
Example Data
Example data is a tool to demonstrate with your stakeholders the sort of reporting that Journeys offers. The example data will simply divide a starting number across all your paths to give an idea of how it would work..

Step Insights
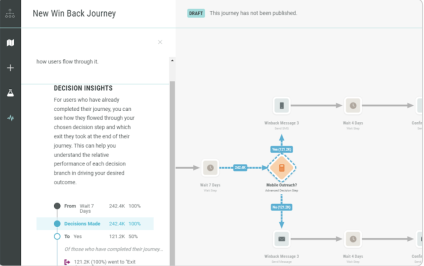
Opening Steps when in your Journey Metrics tab, a panel will display insights for that step. For example:
- Decisions and Splits will show how the split will determine how many customers on each path will end up on a positive, negative, or neutral exit
- Wait steps will
- Wait steps will show you if customers performed an event that you wanted during their wait, to help understand where in the journey the majority of your conversions come from

