
Queries
Analytic Queries are specific Query Strings (or codes) that can be mapped to the Dashboard Panels and Dashboard KPI Tiles to be configured into customizable charts.
Types of Analytic Queries
The Loyalty Marketing Console allows for 3 ways to perform Analytic Queries:
-
Phoenix. The database consists of an Activity Table and a Member Table. Activity Table contains consumer transactional data such as Activity TimeStamp, Activity Type, and Purchases. Member Table contains member data such as Member ID and Member Email.
-
SQL. This standard SQL database consists of consumer transactional data such as Responses, Challenges, Rewards, Giftcards, Events, and Messages.
-
Spark. Spark SQL allows you to read and write data in a variety of structured formats (eg. JSON, Hive Tables, and Parquet). It lets you query the data using SQL, both inside a Spark program and from external tools that connect to Spark SQL through standard database connectors (JDBC/ ODBC), such as business intelligence tools like Tableau.
Different Analytic Queries are used depending on how the consumer transactional data is stored.
Phoenix
A few examples of Phoenix queries and their corresponding Sample Results are shown below:
Note: MEMBER_TABLE, ACTIVITY_TABLE and ACTIVITY_ITEM_TABLE have to be in capitals.
Member Table
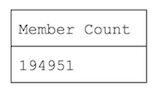
Total Member CountSample Result:
|
SELECT COUNT(*) AS "Member Count" FROM MEMBER_TABLE |
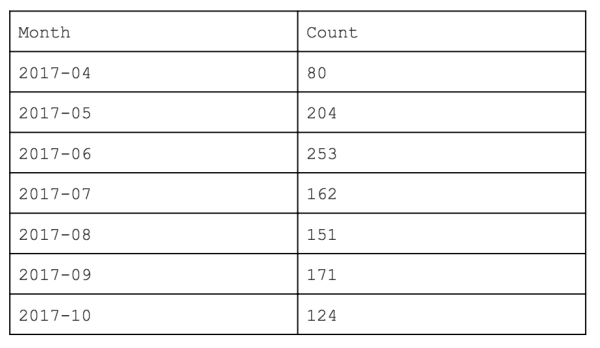
New Member Signups Over TimeSample Result:
|
SELECT (TO_CHAR(member_since, 'yyyy-MM')) AS Month, COUNT(1) AS Count FROM MEMBER_TABLE WHERE in_period(member_since, 'PERIOD') = true GROUP BY Month |
Points Earned, Redeemed, Expired, and BalanceYou can find aggregated points from array in the members table. Note that the array is arranged as such: (earned, redeemed, expired). To calculate the balance, use the formula Point Balance = Points Earned - Points Redeemed - Points Expired. If you want points based on date range, you will need to use ACTIVITY_TABLE to compute it instead as points coming from MEMBER_TABLE only gives the aggregated sum of points. |
SELECT SUM(point[1]) as earned, SUM(point[2]) as redeemed, SUM(point[3]) as expired, SUM(point[1] - point[2] - point[3]) as "Points Balance" FROM MEMBER_TABLE |
Activity Table
Total Member TransactionsSample Result: |
SELECT COUNT(*) AS "Member Transactions" FROM ACTIVITY_TABLE WHERE sl_type = 'sl_purchase' AND sl_member_id is NOT NULL |
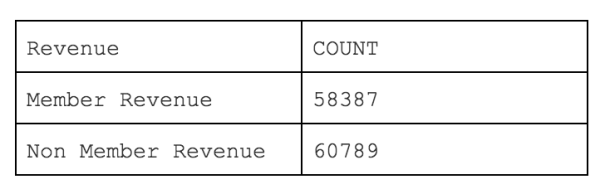
Total Tevenue by Membership (Month to Date)To obtain revenue, filter out:
Sample Result:
|
SELECT * FROM (SELECT 'Member Revenue' AS "Revenue", ROUND(SUM(sl_subtotal),2) AS "Count" FROM ACTIVITY_TABLE WHERE sl_type = 'sl_purchase' AND in_period(sl_activity_ts, 'PERIOD') = true AND (NOT sl_member_id is NULL) UNION ALL SELECT 'Non Member Revenue' AS "Revenue", ROUND(SUM(sl_subtotal),2) AS "Count" FROM ACTIVITY_TABLE WHERE sl_type = 'sl_purchase' AND in_period(sl_activity_ts, 'PERIOD') = true AND sl_member_id is NULL) |
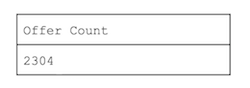
Count of Completed Specific OfferTo obtain completed specific offer:
Sample Result:
|
SELECT COUNT(*) AS "Offer Count" FROM ACTIVITY_TABLE WHERE SL_TYPE = 'sl_offer' AND SL_LABEL = '$5 Offer' AND SL_ACTION = 'complete' |
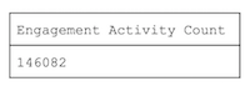
Number of Engagement ActivitiesTo obtain engagement activities:
Sample Result:
|
SELECT COUNT(*) as "Engagement Activity Count" FROM ACTIVITY_TABLE WHERE sl_type in('sl_ar','sl_challenge','sl_prize','sl_game','sl_profile', 'sl_login','sl_sign_up','sl_referral','sl_survey','sl_member_attribute', 'sl_member_preference','sl_view','sl_reward') |
SQL
A few examples of SQL queries and their corresponding Sample Results are shown below:
Total Number of Messages Sent out this YearSample Result: |
SELECT COUNT(*) AS "Sent this year" FROM message_actions JOIN messages ON messages.id = message_actions.message_id WHERE messages.type = 'Message::PushNotification' AND YEAR(message_actions.created_at) = YEAR(CURDATE()) |
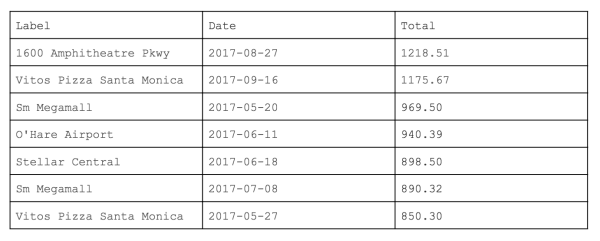
Sales by StoresTo find out which store has the highest sale. Sample Result:
|
SELECT Label, DATE_FORMAT(ordered_at, '%Y-%m-%d') as Date, SUM(total_amount) as Total FROM orders o, locations l WHERE o.place_id = l.id GROUP BY DATE_FORMAT(ordered_at, '%Y-%m-%d'), label ORDER BY SUM(total_amount) DESC |
Spark
Spark SQL allows you to read and write data in a variety of structured formats (eg. JSON, Hive Tables, and Parquet). It lets you query the data using SQL, both inside a Spark program and from external tools that connect to Spark SQL through standard database connectors (JDBC/ ODBC), such as business intelligence tools like Tableau.
A few examples of Spark queries and their corresponding Sample Results are shown below.
Query Type: Group by Member
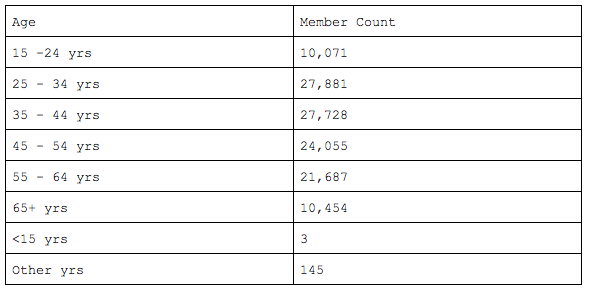
Member Count by Age DistributionSample Result:
|
{ "queryType": "groupByMember", "dimensions": [ { "name": "Age", "expr": "getAgeGroup() + ' yrs'" } ], "measures": [ { "name": "Member Count", "expr": "1.0" } ] } |
Query Type: Group by Activity
|
{ "queryType": "groupByActivity", "filters": [ { "name": "Filter1", "expr": "sumHistoryItems('1', {it.sl_type in ['sl_member_attribute', 'sl_sign_up', 'sl_visitor_sign_up'] }, 'alltime') > 0" } ], "measures": [ { "name": "NumTimes", "expr": "groupHistoryItems({it, ac -> 1}, ['sl_activity_ts', 'sl_type', 'sl_client', 'sl_context', 'sl_submitter', 'sl_member_id', 'item.sl_attribute', 'item.sl_attribute_value', 'item.sl_prev_value'], {it.sl_type in ['sl_member_attribute', 'sl_sign_up', 'sl_visitor_sign_up'] }, {true}, '10/15/2017')", "groupNames": [ "Activity TS", "Activity Type", "Client", "Context", "Submitter", "Member ID", "Attribute", "Value", "Prev Value" ] } ] } |
Analytic Query Configuration
Creating Queries
Use the Analytics | Settings | Queries screen to create, delete or edit Queries. You create a new Query by specifiying a Query Name and clicking on the Create button.
-
Labels to be specified:
-
Description. Optionally include a description about the query.
-
Visualization. Select “Home Dashboard” for the query to be mapped into Dashboards.
-
Execution Type. Select the way to execute the query (Phoenix, SQL, Spark). This can be changed later.
Query is created once the Save button is clicked.
Editing Queries
Upon creating a Query, use the Analytic Query | Definition screen to select the Execution Type and enter the query string.
-
Phoenix. For Phoenix queries, enter a Phoenix SQL query string to pass to the Loyalty Analytics engine.
-
SQL. For SQL queries, enter a SQL query string to pass to the Loyalty Analytics engine.
-
Spark. For Spark queries, enter the Loyalty JSON query string to pass to Loyalty Analytics engine.
Editing Time Parameters
Use the Analytic Query | Definition screen to set a time parameter key by clicking on the Edit button of the Parameters box.
-
Key. Set as “PERIOD”
-
The list of Default parameters:
-
last7d - Last 7 days
-
last90d - Last 90 days
-
last3m - Last 3 months
-
last12m - Last 12 months
-
last1y - Last 1 year
-
mtd - Month to date
-
ytd - Year to date
Viewing Query Results
Use the Analytic Query | Results screen to execute the query and view the results. By default, this screen shows a cached version of the last query execution. Click on the Update Cache button to instruct the Loyalty Cloud Platform to re-execute the query. You can also click Export to export the results to a .csv file.
Setting Analytic Query KPIs
Use the Analytic Query | KPIs screen to define one or more KPIs for the Analytic Query.
-
Defining KPIs:
-
Click Edit button on the top right hand corner of the KPIs box.
-
Click Add KPI buuton on the top left hand corner of the “Edit Bigdata Query” sub-box.
-
Define a column key or a row key to be the KPI.
KPI is defined once the Save button is clicked.
Note: Defining KPIs are required for Queries to be visible and mapped into
-
KPI Tiles
-
The following panels:
-
‘Single Chart with KPI’
-
‘Donut Chart with KPI’
-
‘Dual Chart with KPI’
-
‘KPI’
-
‘KPI Gauge’

