Real Time Analytics - User Guide
Real time analytics provide marketers with the ability to measure and review what is currently happening with their email, push, and SMS campaigns. Data is shown in real time and the dashboards include consolidated multi-campaign as well as single-campaign reports, providing insights on engagement, delivery, location based stats and link activity.
Note: In order to use the new Real time analytics reports, you need to login to the product using Zeta Login.
Campaign dashboards
Campaign dashboards provide insight into how your different channels are performing. You can access various dashboards depending on the information you wish to see.
We offer two main types of dashboards, multi and single campaign, which are further categorized based on the channel you are interested in:
Multi-campaign dashboards
Multi-campaign dashboards provide statistics across all campaigns within the Email, Push, or SMS channels.
Depending on the channel that you are looking for, you can choose from one of the following dashboards:
-
Multi-campaign Email dashboard: For data pertaining to all Email Campaigns
-
Multi-campaign Push dashboard: For data pertaining to all Push Campaigns
-
Multi-campaign SMS dashboard: For data pertaining to all SMS Campaigns
-
Multi-campaign RCS dashboard: For data pertaining to all RCS Campaigns
Single-campaign dashboards
Single-campaign dashboards allow for a more detailed view per individual campaign. In other words, you can drill down into a single campaign to see how it is performing.
-
Single-campaign Email dashboard: Showing data for a singular Email Campaign
-
Single-campaign Push dashboard: Showing data for a singular Push Campaign
-
Single-campaign SMS dashboard: Showing data for a singular SMS Campaign
-
Single-campaign RCS dashboard: Showing data for a singular RCS Campaign
Follow the links for the different dashboards outlined above for more information on which reports they contain and what you can expect to see in each.
Reports
Depending on which dashboard you choose, there will be a selection of the following seven reports:
Engagement report
The Engagement report provides marketers with insights on how well their campaigns are doing and if they are creating engagement. Are your campaigns reaching the intended audience, are customers opening your campaigns and are they engaged with your content? Are they clicking through?
Delivery report
The Delivery report tells marketers if their messages are reaching the inbox and how many don't get delivered because of spam complaints, optouts or other bounce reasons (such as bad email addresses).
Links report
The Links report focuses on human and non-human click interaction, providing totals for the selected time period as well as an evolution over time. For marketers, it is important to know how much interest is generated through their emails. They can obtain this information by looking at click interactions but filtering out the non-human interactions. Also, insights on how these interactions evolve over time can provide valuable information for future campaign planning.
Realtime report
This report provides live engagement reporting (emails sent, opened, clicked, hard and soft bounced, unsubscribed) and show how respondents are engaging with your campaigns in real time. The graph is continuously evolving within a time frame of less than a minute.
Geography report
Are your campaigns doing well in one region and not in another? Should you change your approach for specific regions where engagement is low compared to others? The Geography report allows you to compare engagement over the different countries.
Audience report
The Audience report aims to provide a deeper perspective on performance, allowing you to understand how frequently contacts are messaged, how they respond, and how audience composition evolves over time. The Audience tab consolidates engagement, frequency, and list health data which supports smarter optimization of messaging strategies.
Conversions report
The Conversion report is designed to give marketers clear, campaign-level insight into how their messaging drives revenue outcomes. This report aims to provide foundational revenue reporting across email, SMS, and push campaigns, all tied to attributed purchase data.
General functionality
The following are some general functionalities that will allow you to maximize the data available, including applying filters, sharing, and exporting.
Filters in multi-campaign dashboards
Marketers can narrow results down to a period of time they are interested in, such as the last quarter, the last year, last 30 days or even a custom date range.
Use the filter buttons available on each report, to narrow down the results to a specific time period.
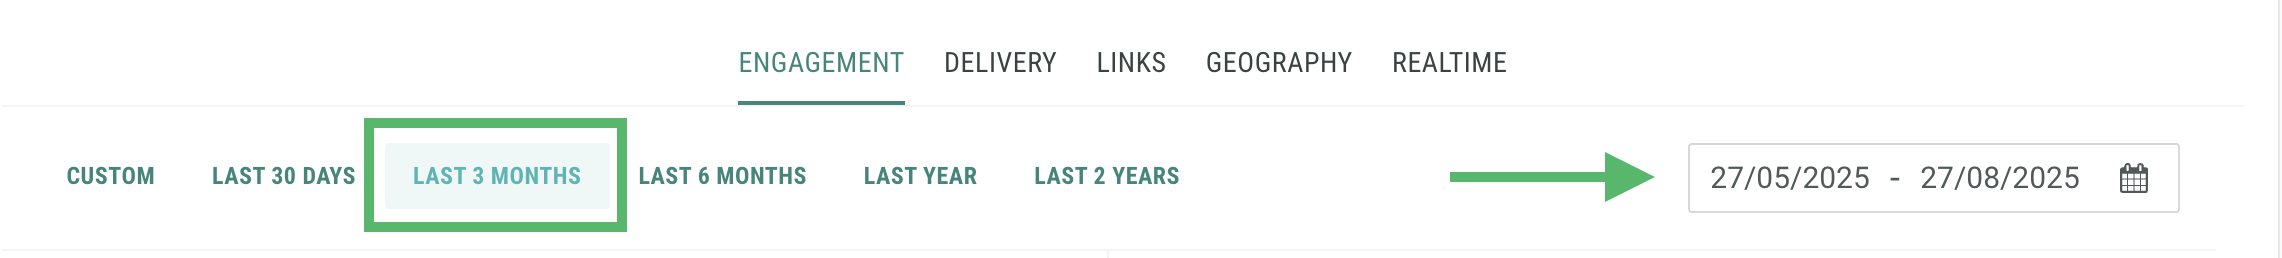
When a filter is selected, the date field on the right reflects the exact dates for the selected filter.
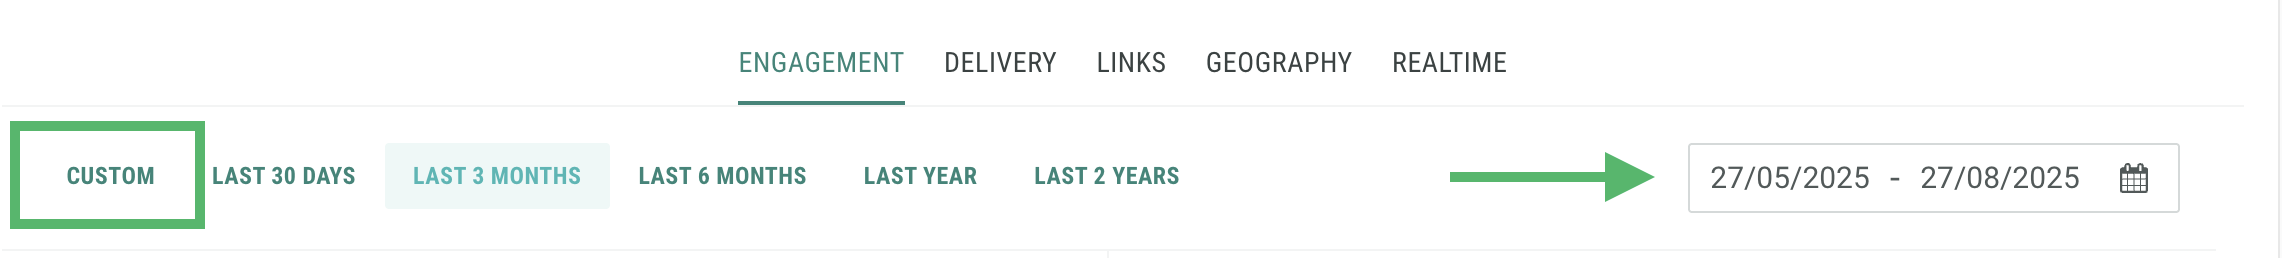
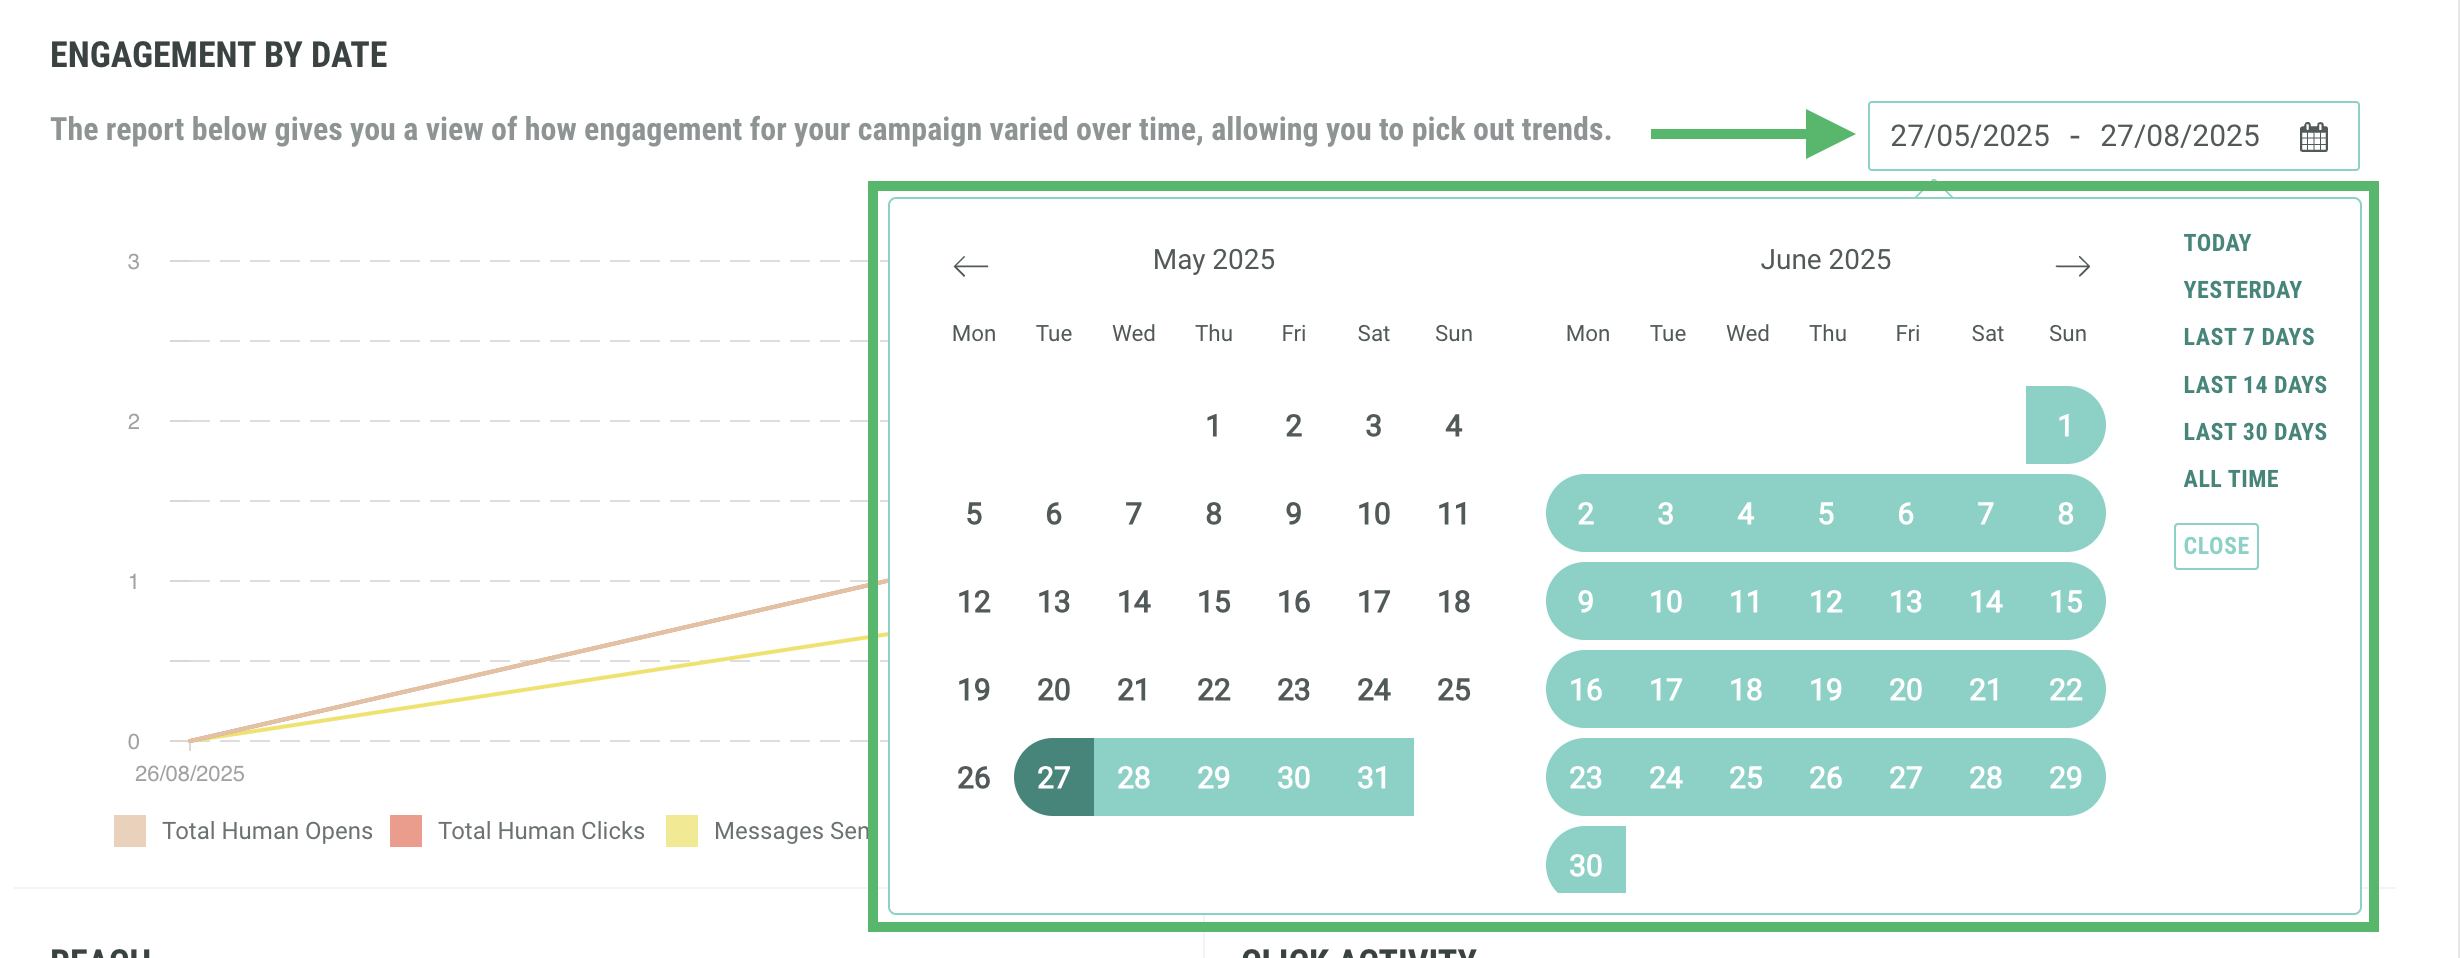
You can also define a custom date range, by selecting the Custom filter tab, and then manually enter the date range in the Date field on the right:
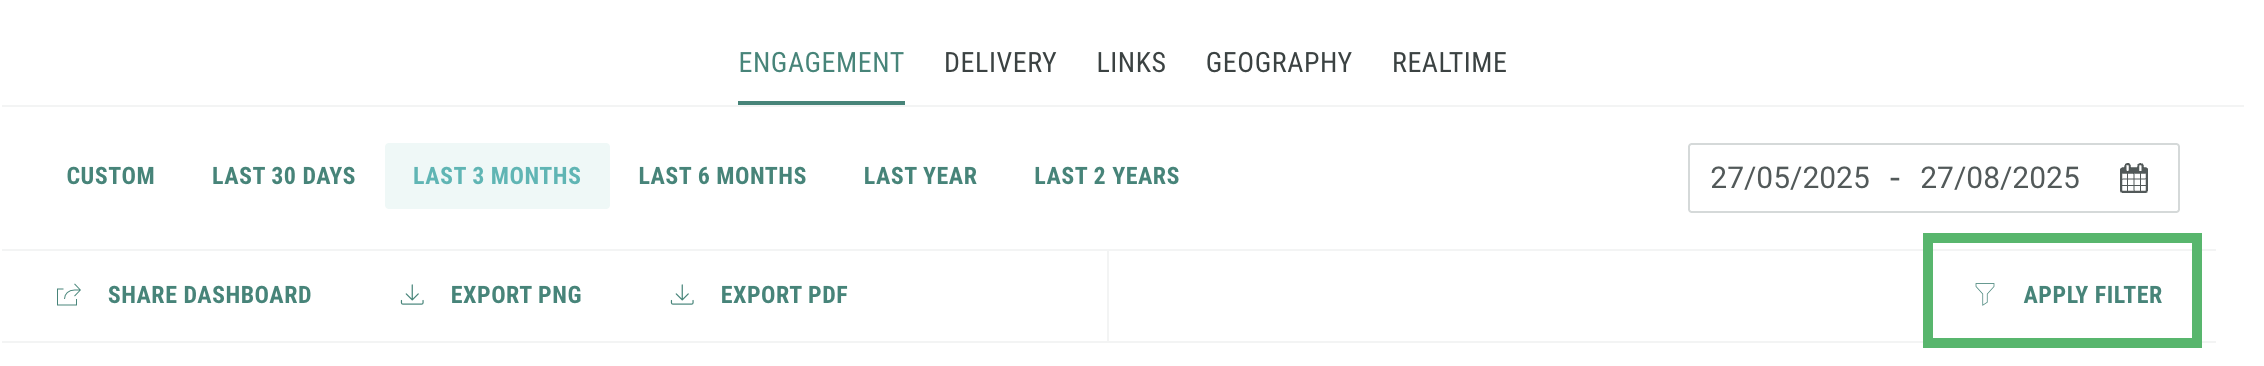
Further filter options are available in multi-campaign Email Dashboard. To use these filters, click Apply Filter.
In the displayed Filters popup window, select the required filter option from the Filter by drop-down list. You can select one or more filters from the following filter options:
- Campaign folder
- Campaign metadata
- Campaign name
- Campaign tag
- Campaign type
- Channel (only available in the cross-channel dashboard)
- Sender Profile
Based on the selected option, you can define your filter criteria in the displayed additional fields.
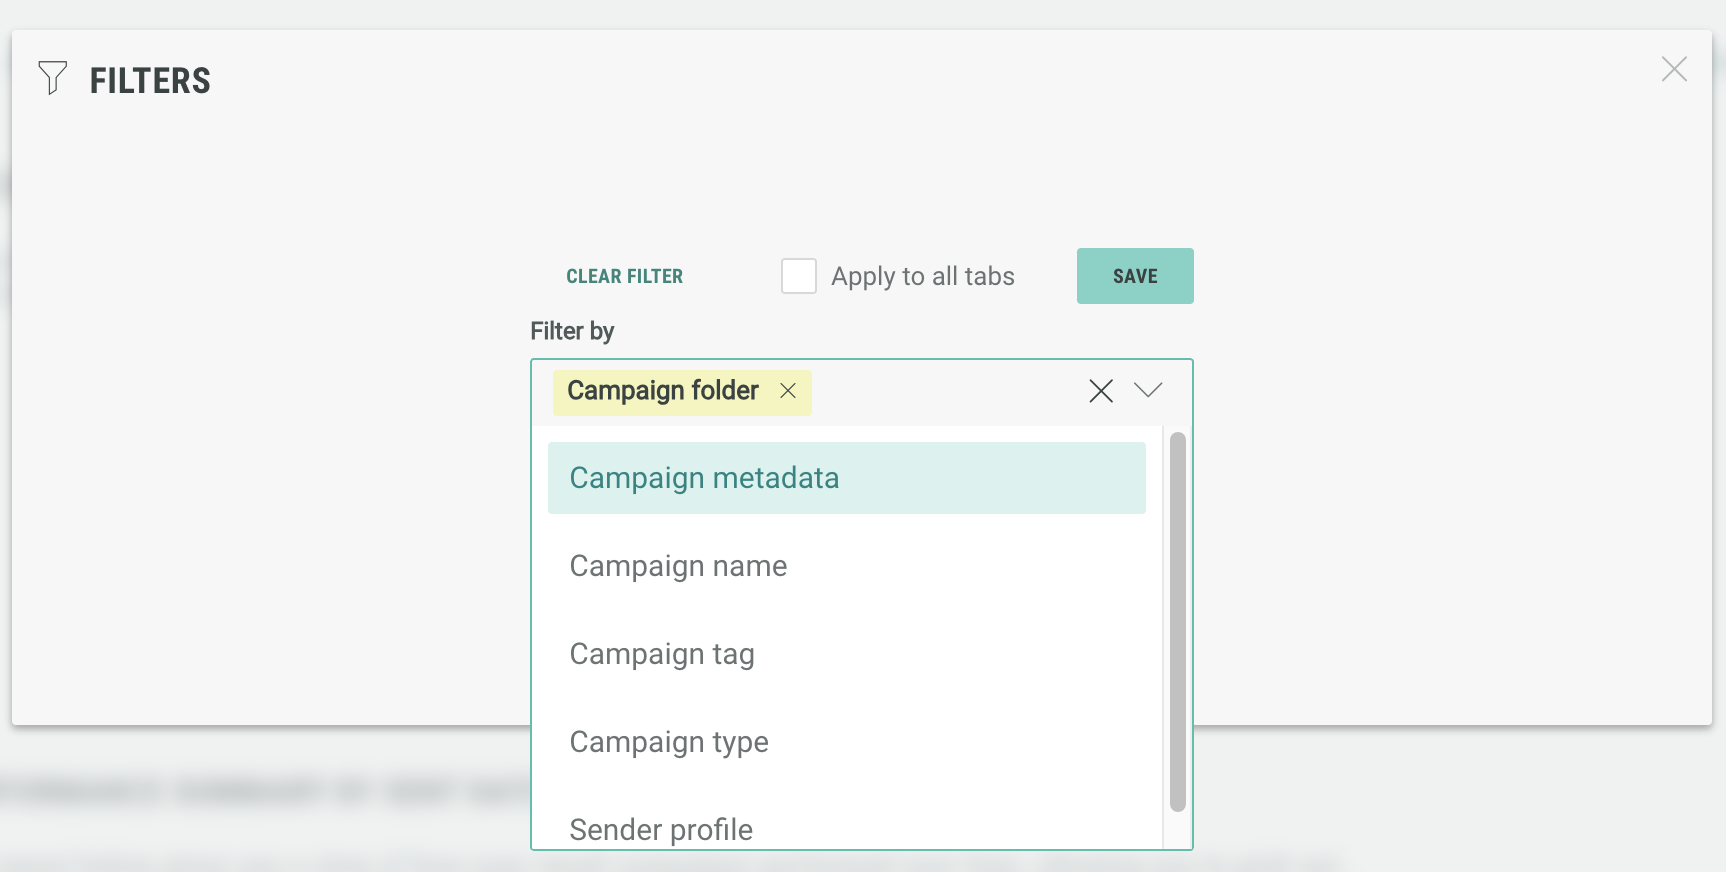
If you want to apply the filters to all the report tabs in the dashboard, select Apply to all tabs checkbox.
Finally click Save to apply the filters and close the popup window to return to the dashboard showing the updated statistics as per your applied filters. To clear your filters, click Clear Filter.
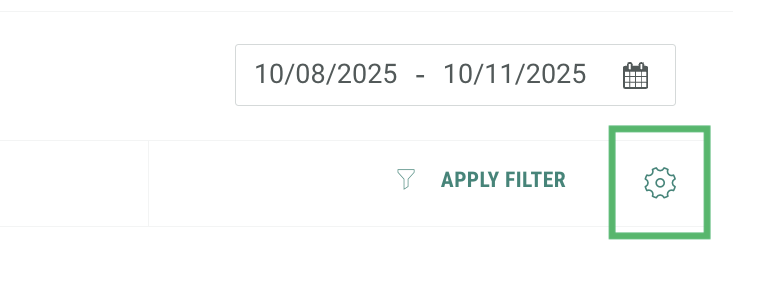
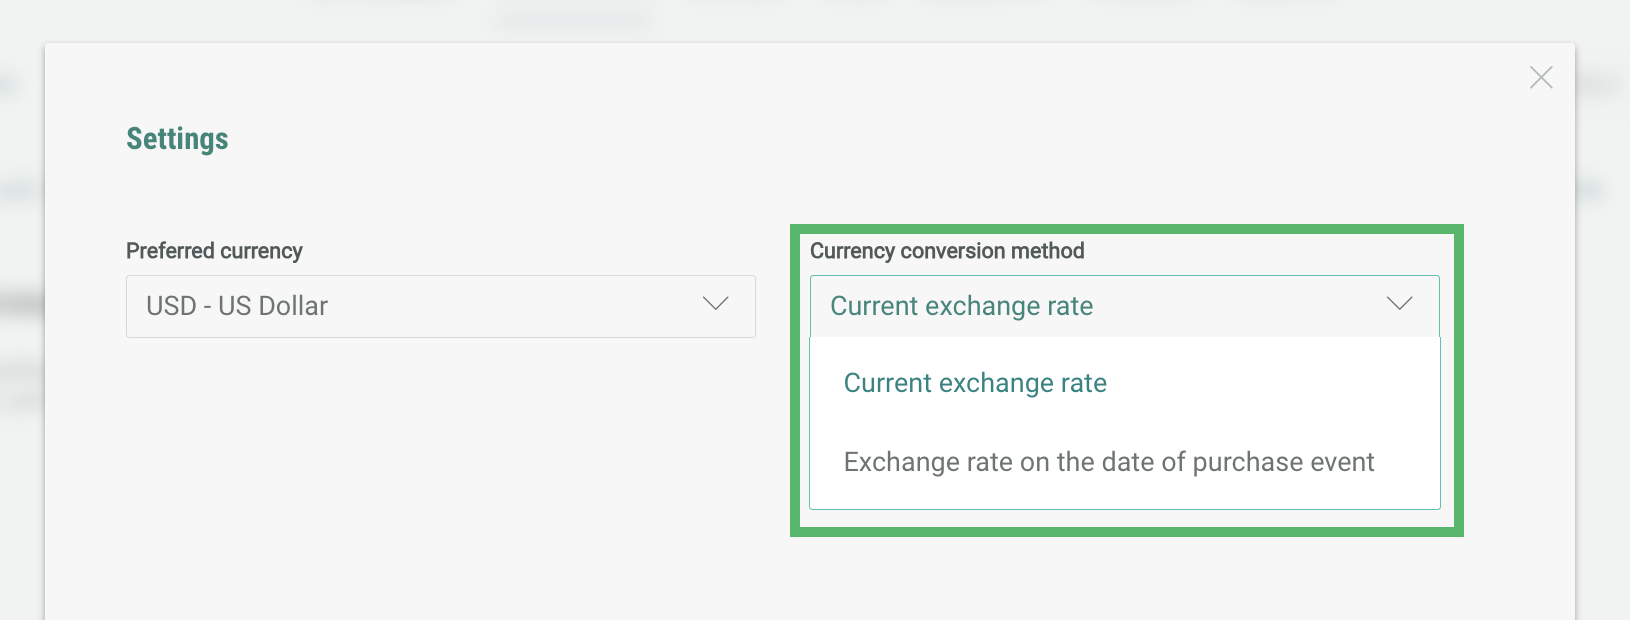
Additionally, if you collect revenue data and you have the Conversions report available, you can choose the exchange rate that is applied to your dashboard.
Click the settings cog on the right hand side of the dashboard
In the new pop-up, you can select your currency from the drop down available. You can also change the exchange strategy, choosing from either of the following options:
- Current exchange rate (default)
- Exchange rate on the date of purchase event
Filters in single campaign dashboards
Single Campaign Dashboards have more limited filters available. You apply time range filters, only, to individual reports within the dashboards.
Click on the date range on the right hand side of the report and choose the dates from the calendar, or from the time range filters available.
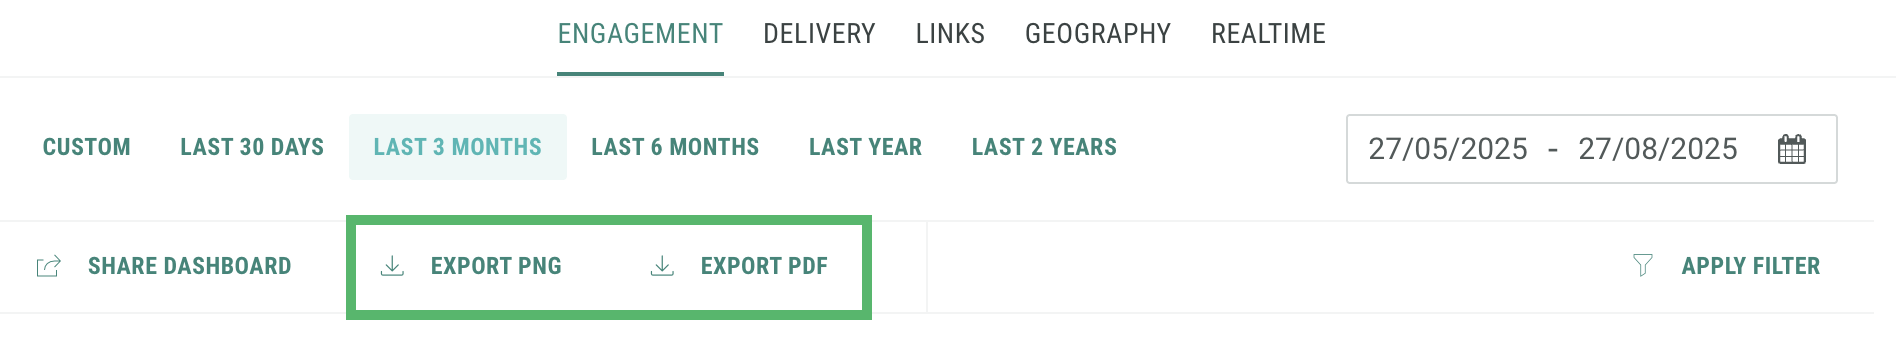
Export dashboards and data
Dashboards can be exported in .png or .pdf format, allowing marketers to keep a history of the different reports over time or to simply share a hard copy of the report with team members.
Use the export buttons on the left to download the current version of the dashboard.
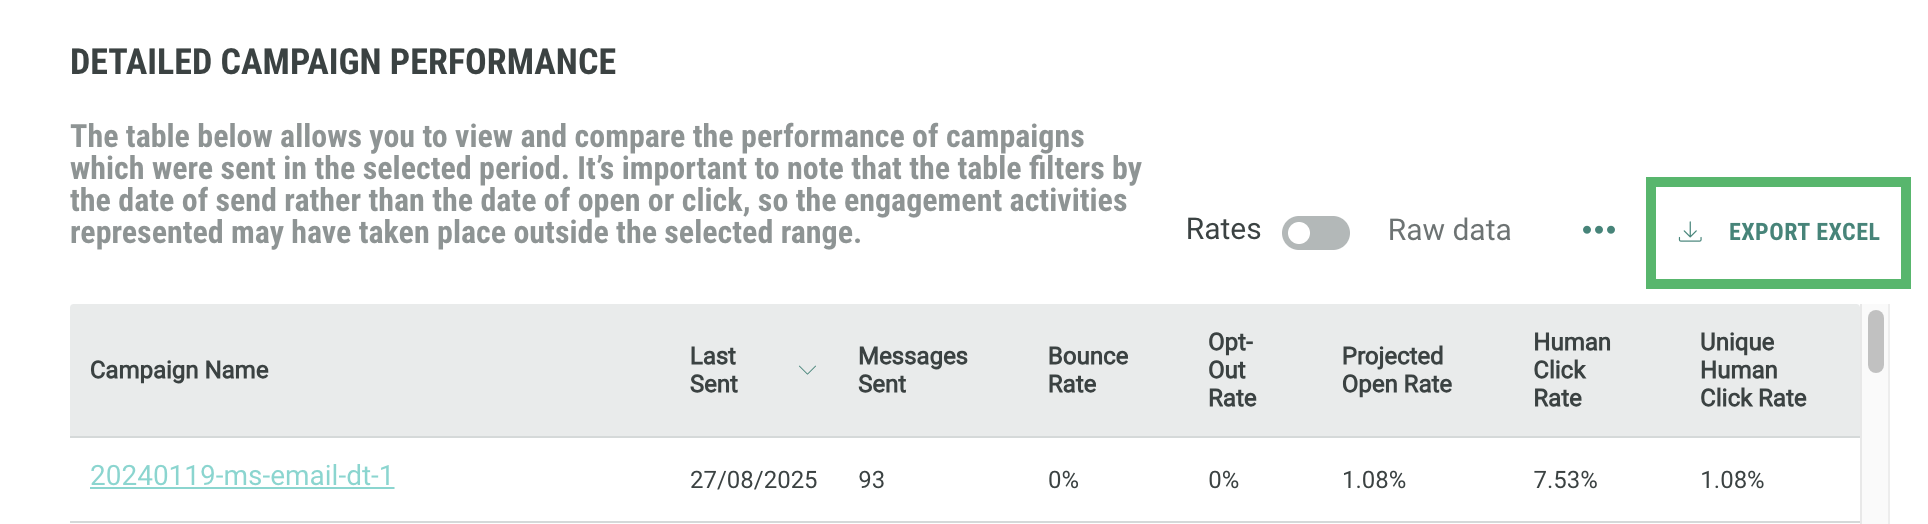
Alternatively, click Export Data to download the raw data in a .CSV or excel format. This download includes raw metric counts only, and therefore no rates, percentages, or calculated fields.
Table views can also be exported separately to a comma separated csv file:
Share dashboards
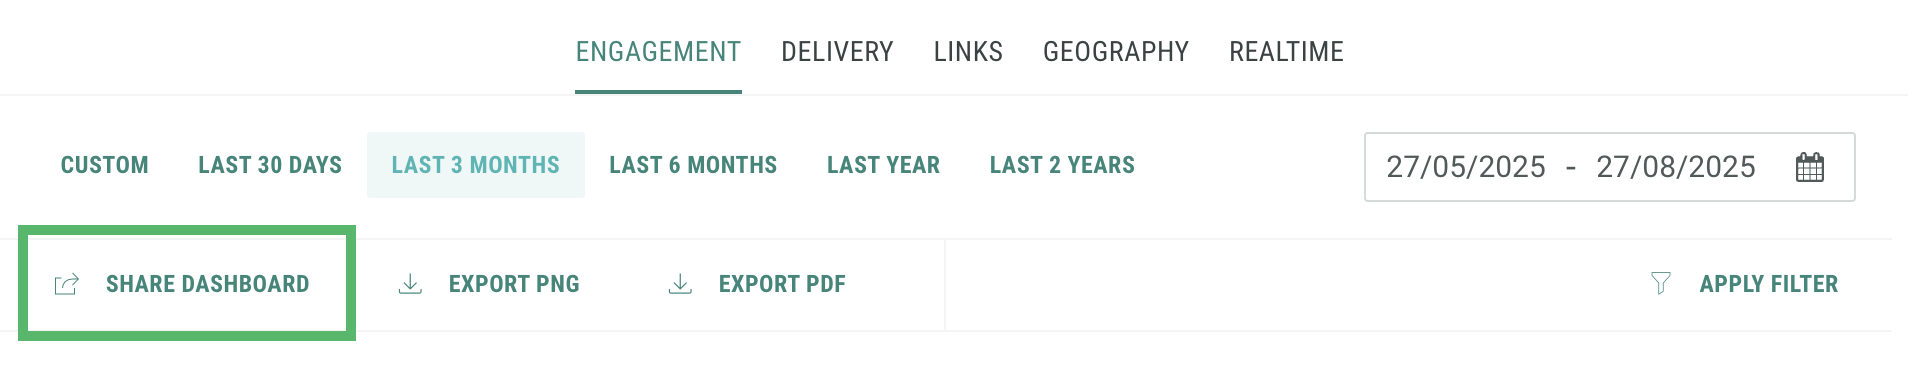
Marketers who are interested in sharing a link to the actual report can do so with the sharing option.
-
Click Share Dashboard.
-
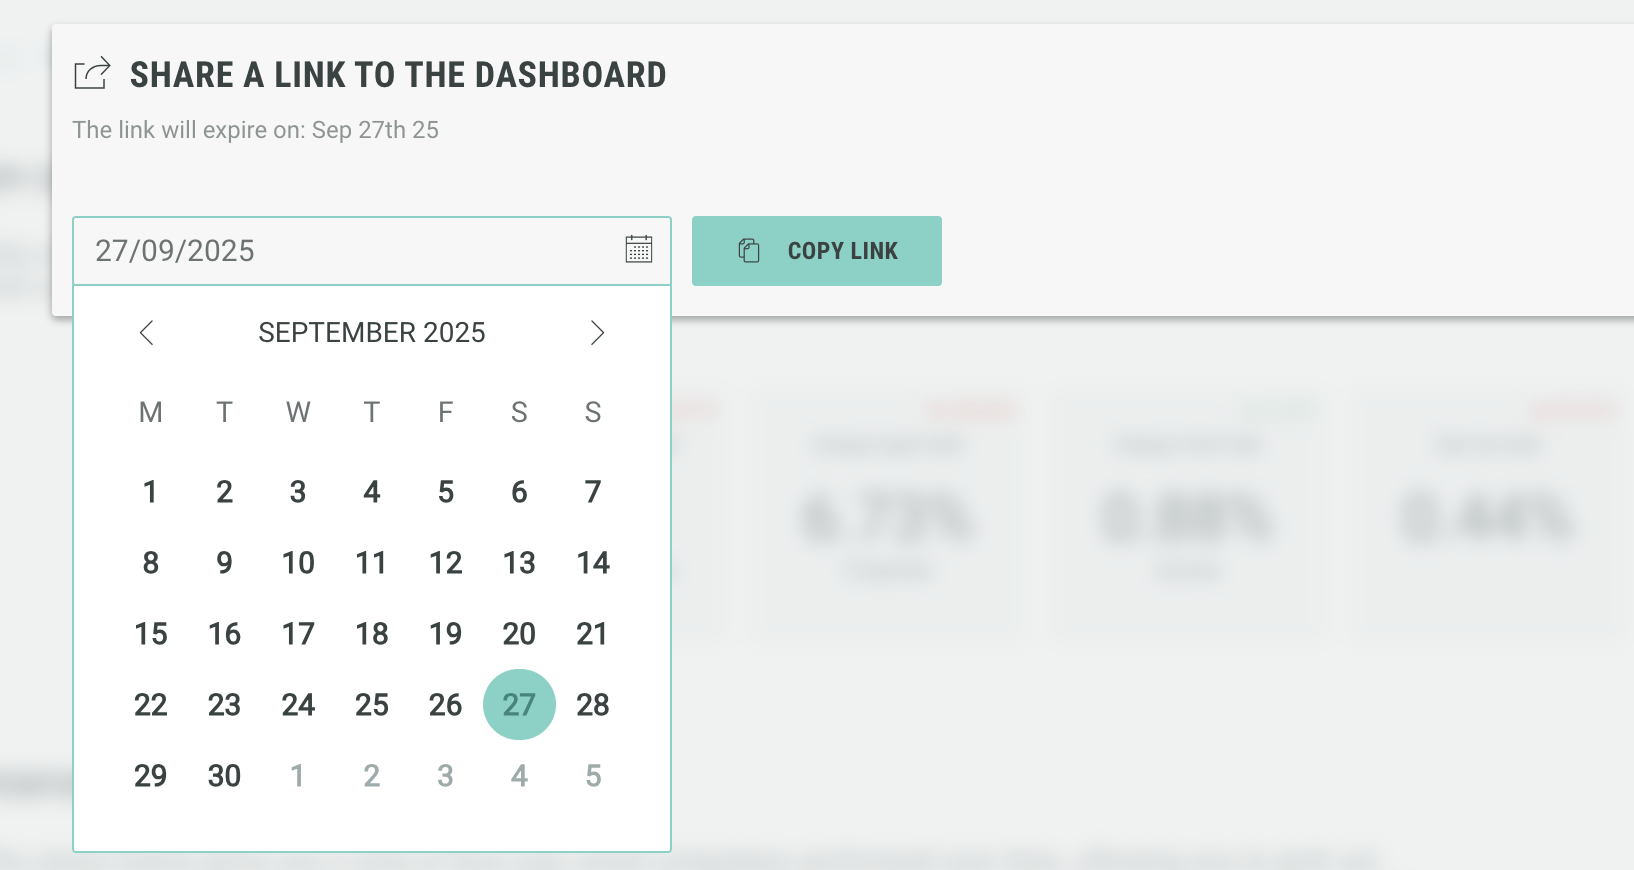
Choose an expiration date for the link and click Copy link to copy it to your clipboard. The link only remains valid until the given expiry date.
-
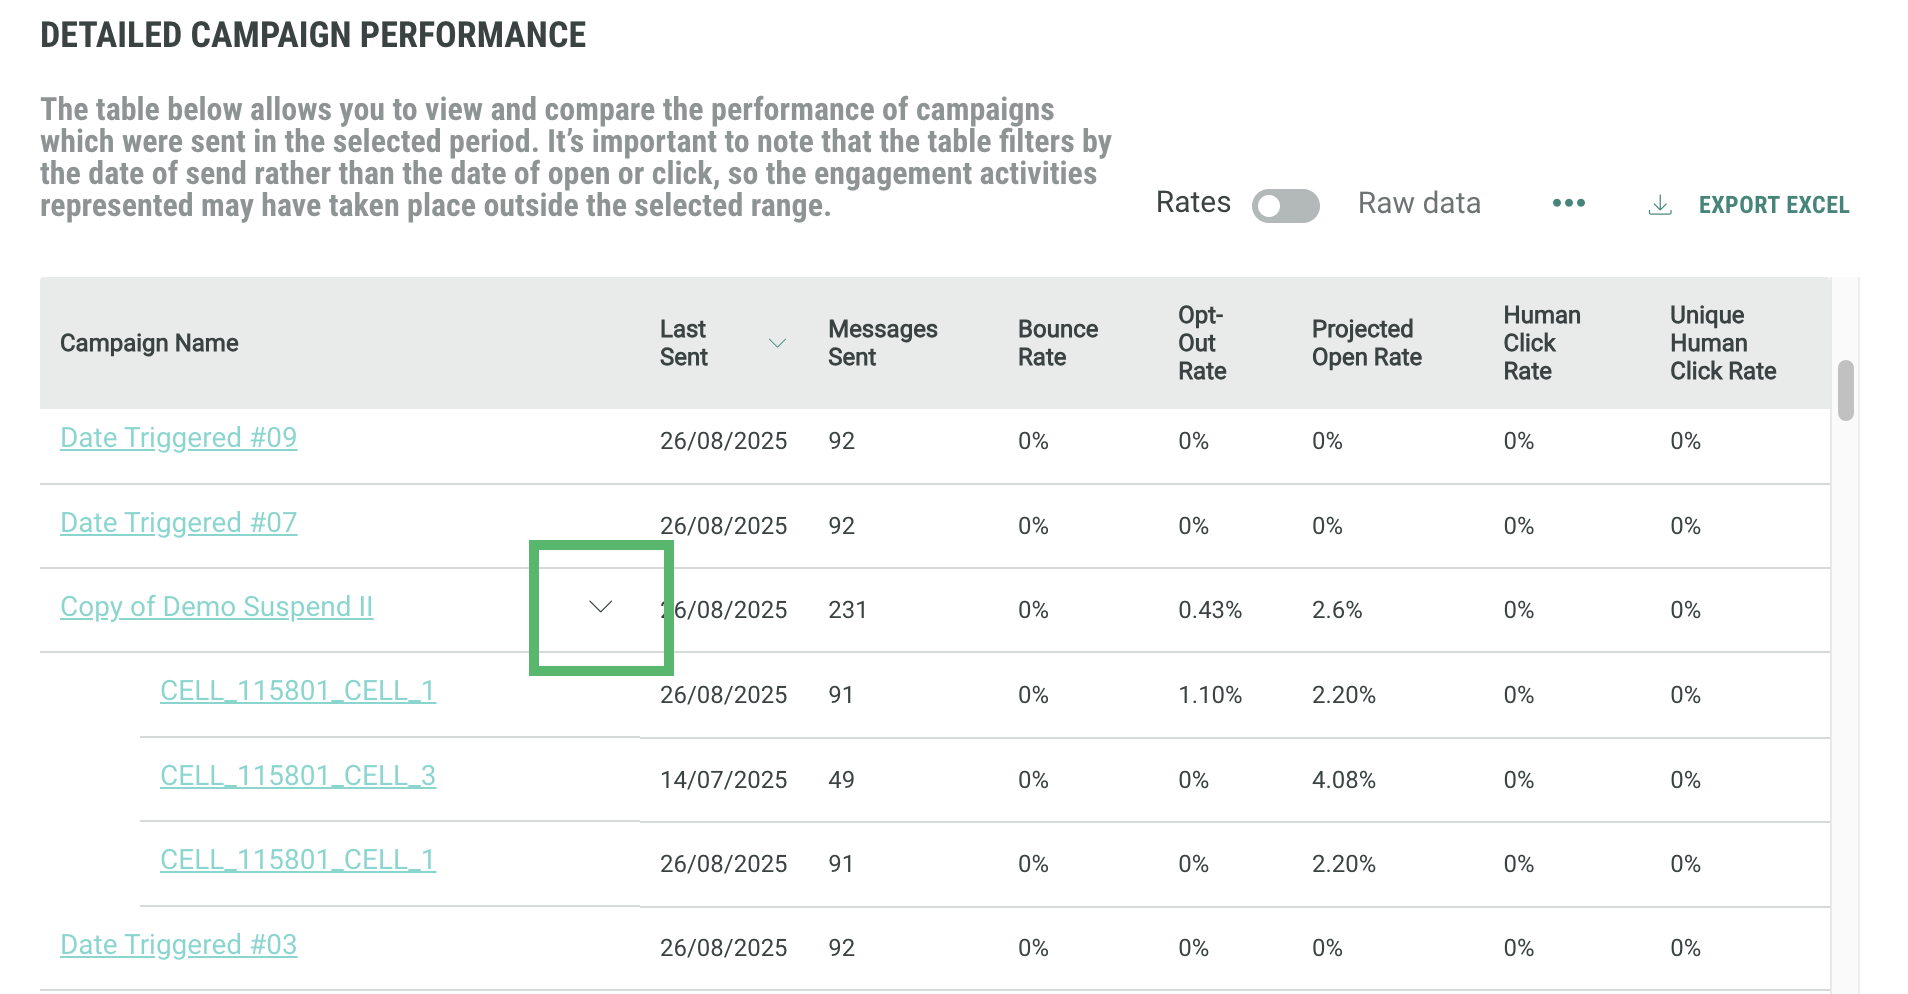
In the Engagement and Delivery Report, when the Detailed Campaign Performance and Detailed Campaign Delivery sections list parent campaigns with child cells, you can click on the arrow next to the campaign to expand the list to show all the child cells.